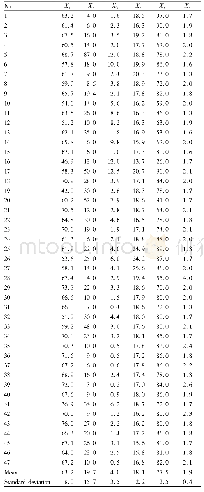
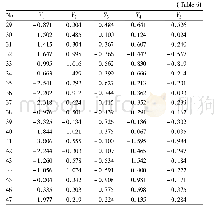
《Table 1 Quality traits of rice varieties》
 提示:宽带有限、当前游客访问压缩模式
本系列图表出处文件名:随高清版一同展现
《Principal Component and Cluster Analysis of Quality Traits in Ningxia Rice》
The principal component analysis and cluster analysis were performed with SPSS.At first,six rice quality traits were subjected to principal component analysis,to establish principal component equations.During the analysis,the standardization of various quality traits adopted following formula x=(x-x/S)(wherein x is the mean value,and S is the standard deviation,as shown in Table 1) .Then,the values of principal components were calculated using the established principal component equations.With these principle component values as indices,clustering analysis was performed to the 47 varieties by Ward’s method.According to the results of cluster analysis,rice quality of various rice varieties was comprehensively evaluated.Specific evaluation standards were formulated according to high-quality rice standards GB/T17891-1999 established by State Bureau of Quality Technical Supervision and appearance evaluation standards of Ningxia local high-quality rice.The quality traits were graded and scored 0-3 points,as shown in Table 2.
| 图表编号 | XD00183117300 严禁用于非法目的 |
|---|---|
| 绘制时间 | 2018.10.01 |
| 作者 | Jing MA、Jianchang SUN、Yongping AN、Caifen WANG |
| 绘制单位 | Crop Research Institute,Ningxia Academy of Agriculture and Forestry、Crop Research Institute,Ningxia Academy of Agriculture and Forestry、Crop Research Institute,Ningxia Academy of Agriculture and Forestry、Crop Research Institute,Ningxia Academy of Agricult |
| 更多格式 | 高清、无水印(增值服务) |


