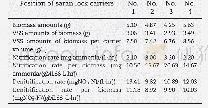
《Table 2 The biomasses and distribution of T.flousiana plantation and successive rotation plantation
 提示:宽带有限、当前游客访问压缩模式
本系列图表出处文件名:随高清版一同展现
《Biomass Productivity of Taiwania flousiana Plantation and Successive Rotation Plantation of Cunninghamia lanceolata in Cutover Forest Land of C. Lanceolata》
t/hm2
As shown in Table 2,the stand biomass was 206.82 t/hm2and 146.13 t/hm2,respectively for the 23-year-old T.flousiana plantation and successive rotation plantation of C.lanceolata.The biomasses for the arborous layers of the 2 types of plantations were195.21 and 136.32 t/hm2,respectively,accounting for 94.39%and 93.29%of the stand biomasses;the biomasses for the shrub layers were 4.57 and 5.14 t/hm2,which accounted for 2.41%and 3.52%,respectively;the biomasses of the litter layers were7.04 and 4.67 t/hm2,respectively,accounting for 3.40%and3.20%.As for the distribution of biomass in the arborous layer of the T.flousiana plantation,the stem(economic)biomass was118.32 t/hm2,which was 1.35 times of that of successive rotation plantation of C.lanceolata;the canopy(leaves+branches)biomass was 44.51 t/hm2,which was 2.5 times of that of successive rotation plantation of C.lanceolata;the root biomass was24.88 t/hm2,which was 1.6 times of that of successive rotation plantation of C.lanceolata;only the bark biomass(7.50 t/hm2)was slightly less than that of successive rotation plantation of C.lanceolata(9.56 t/hm2).
| 图表编号 | XD00183082400 严禁用于非法目的 |
|---|---|
| 绘制时间 | 2018.08.01 |
| 作者 | Kai LIU、Jiaguo WEI、Bin HE、Ji LIANG、Fansheng LIU、Zhengwen YANG |
| 绘制单位 | Forestry College,Guangxi University、Shankou Forest Farm of Nandan County、Forestry College,Guangxi University、Forestry College,Guangxi University、Shankou Forest Farm of Nandan County、Shankou Forest Farm of Nandan County |
| 更多格式 | 高清、无水印(增值服务) |
查看“Table 2 The biomasses and distribution of T.flousiana plantation and successive rotation plantation of C.lanceolata”的人还看了
-

- Table 3 Net productivity of T.flousiana plantation and successive rotation plantation of C.lanceolata
-

- Table 1 The biomasses and distribution of average tree of T.flousiana plantation and successive rotation plantation of C
-

- Table 2 Bioclimatic and topographic variables used for modelling the suitable distribution of Subpsaltria yangi in this


