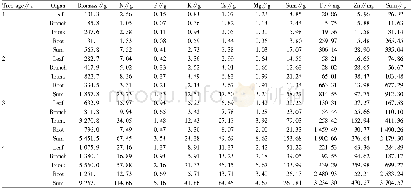
《Table 1 The biomasses and distribution of average tree of T.flousiana plantation and successive rot
 提示:宽带有限、当前游客访问压缩模式
本系列图表出处文件名:随高清版一同展现
《Biomass Productivity of Taiwania flousiana Plantation and Successive Rotation Plantation of Cunninghamia lanceolata in Cutover Forest Land of C. Lanceolata》
The data in parentheses are the percentages(%)of the biomass in the organ to the biomass of the whole plant.
As shown in Table 1,the average biomass per tree was209.90 and 144.02 kg/plant,respectively for the 23-year-old T.flousiana plantation and successive rotation plantation of C.lanceolata.The former was 1.46 times greater than that of the latter.The distribution ratio of biomass in various organs of forest trees differed depending on the type of stand.As for the T.flousiana plantation,the distribution ratio was in the order of stems(60.61%)>branches(15.46%)>roots(14.46%)>leaves(5.62%)>barks(3.84%),and for the successive rotation plantation of C.lanceolata,the order was stems(64.25%)>roots(15.74%)>branches(8.84%)>barks(6.99%)>leaves(4.18%).Thus,although proportion of stem biomass of T.flousiana plantation was slightly lower than that of successive rotation plantation of C.lanceolata,the biomass of the stems of T.flousiana plantation was 1.35 times that of successive rotation plantation of C.lanceolata,and there was a significant difference between the two(P<0.05).Moreover,the biomass of the canopy(branches+leaves)of T.flousiana plantation was significantly higher than that of successive rotation plantation of C.lanceolata,which was beneficial to the photosynthesis of the trees in the plantation.It was also the reason why the biomass of the T.flousiana plantation was significantly higher than that of the successive rotation plantation of C.lanceolata.
| 图表编号 | XD00183082700 严禁用于非法目的 |
|---|---|
| 绘制时间 | 2018.08.01 |
| 作者 | Kai LIU、Jiaguo WEI、Bin HE、Ji LIANG、Fansheng LIU、Zhengwen YANG |
| 绘制单位 | Forestry College,Guangxi University、Shankou Forest Farm of Nandan County、Forestry College,Guangxi University、Forestry College,Guangxi University、Shankou Forest Farm of Nandan County、Shankou Forest Farm of Nandan County |
| 更多格式 | 高清、无水印(增值服务) |
查看“Table 1 The biomasses and distribution of average tree of T.flousiana plantation and successive rotation plantation of C”的人还看了
-

- Table 2 The biomasses and distribution of T.flousiana plantation and successive rotation plantation of C.lanceolata


