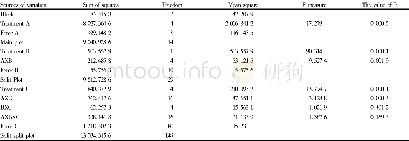
《Table 6 The agronomic efficiencies of nitrogen in different test sites, different amounts of nitrog
 提示:宽带有限、当前游客访问压缩模式
本系列图表出处文件名:随高清版一同展现
《Yields and Nitrogen Use Efficiencies of Rice (Oryza sativa) at Different Sites Using Different Nitrogen Fertilizer Application Rates and Controlled-release Urea to Conventional Urea Ratios》
The nitrogen use efficiencies(Table 6)were significantly different at different test sites,for the different nitrogen application rates,and for the different CRU∶U ratios.A significant interaction was found for the nitrogen use efficiency between the test site and the CRU∶U ratio,but no significant interactions were found between other pairs of factors(Table 7).
| 图表编号 | XD00183044500 严禁用于非法目的 |
|---|---|
| 绘制时间 | 2018.06.01 |
| 作者 | Hong XIONG、Lin ZHANG、Yongchuan ZHU、Xiaoyi GUO、Peng JIANG、Mao LIU、Xingbin ZHOU、Fuxian XU |
| 绘制单位 | Rice and Sorghum Institute,Sichuan Academy of Agricultural Sciences、Key Laboratory of Southwest Rice Biology and Genetics and Breeding,Ministry of Agriculture、Luzhou Branch of National Rice Improvement Center、Rice and Sorghum Institute,Sichuan Academy of |
| 更多格式 | 高清、无水印(增值服务) |
查看“Table 6 The agronomic efficiencies of nitrogen in different test sites, different amounts of nitrogen and ratios of cont”的人还看了
-

- Table 3 Diversity of 8 agronomic traits of proso millet germplasm resources in the mountainous area of southern Ningxia
-

- Table 3 Agronomic characters of flue-cured tobacco in different treatments 98 d after the tobacco seedlings were transpl


