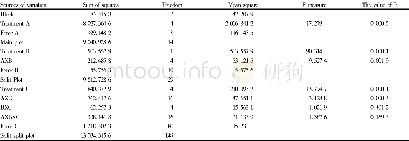
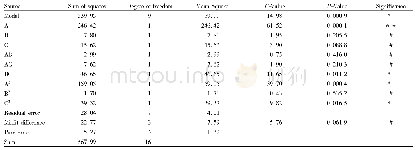
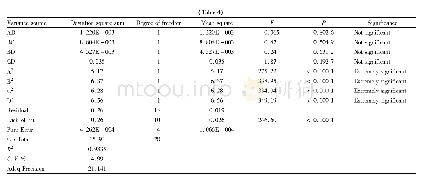
《Table 7 The analysis of variance in agronomic utilization of nitrogen》
 提示:宽带有限、当前游客访问压缩模式
本系列图表出处文件名:随高清版一同展现
《Yields and Nitrogen Use Efficiencies of Rice (Oryza sativa) at Different Sites Using Different Nitrogen Fertilizer Application Rates and Controlled-release Urea to Conventional Urea Ratios》
The sizes of the workforce and cost at the different field sites were very different.To account for these differences,we assumed that the input cost(phosphorus and potassium fertilizers,pesticides,herbicides,planting and transplanting rice seedlings,field management,rice harvesting,and rice drying)were the same for the nitrogen application rates of 105 and 150 kg/hm2at each site.Differences in the output prices would therefore be caused by the difference in the application rate.As shown in Table 8,output for the 150 kg/hm2treatment was 3 078.84 Yuan higher than the output for the 105 kg/hm2treatment.Applying the same principal to the different fertilizer ratio treatments,the outputs for the 70∶30,50∶50,30∶70,and 100∶0 CRU∶U ratio treatments at a nitrogen application rate of 105 kg/hm2were2 097.44,1 631.79,1 235.11,and 981 yuan/hm2higher,respectively,than the output for the 0∶100 CRU∶U ratio treatment.Similarly,the outputs for the 70∶30,50∶50,30∶70,and 100∶0 CRU∶U ratio treatments at a nitrogen application rate of 150 kg/hm2were 1 685.67,1 418.67,1 135.72,and 477.48 yuan/hm2higher,respectively,than the output for the 0∶100 CRU∶U ratio treatment.Therefore,the 70∶30CRU∶U ratio provided the highest income at both application rates.Increasing the nitrogen application rate decreased the output efficiency because CRU is expensive,so the nitrogen input costs increased.
| 图表编号 | XD00183042600 严禁用于非法目的 |
|---|---|
| 绘制时间 | 2018.06.01 |
| 作者 | Hong XIONG、Lin ZHANG、Yongchuan ZHU、Xiaoyi GUO、Peng JIANG、Mao LIU、Xingbin ZHOU、Fuxian XU |
| 绘制单位 | Rice and Sorghum Institute,Sichuan Academy of Agricultural Sciences、Key Laboratory of Southwest Rice Biology and Genetics and Breeding,Ministry of Agriculture、Luzhou Branch of National Rice Improvement Center、Rice and Sorghum Institute,Sichuan Academy of |
| 更多格式 | 高清、无水印(增值服务) |


