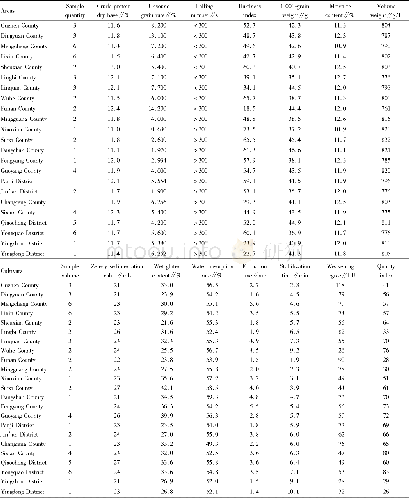
《Table 2 Average quality index of samples from different areas》
 提示:宽带有限、当前游客访问压缩模式
本系列图表出处文件名:随高清版一同展现
《Analysis and Evaluation of Grain Quality in Main Wheat Production Areas of Anhui Province》
In 2015,the range of volume weight of samples for testing was 721-842 g/L with an average of 796 g/L.39 samples with volume weight above first grade(≥790 g/L)accounted for 62.9%of the total samples;16 samples with volume weight above second grade(≥770 g/L-﹤790 g/L)accounted for 25.8%of the total samples;three samples with volume weight above third grade(≥750 g/L-﹤770 g/L)accounted for 4.8%of the total samples;four samples with volume weight of the fourth grade and below accounted for 6.5%of the total samples.The hardness index ranged from 9.7 to 73.5 with an average of 49.2.The hardness index reached the standard of hard wheat(hardness index≥60)in 26 samples,accounting for 41.9%of the total samples;the hardness index reached the standard of mixed wheat(hardness index=40-60)in 14 samples;the hardness index reached the standard of soft wheat(hardness index<40)in 22samples.The variation range of unsound kernel rate was 0.6%-21.3%,with an average of 6.3.There were 38 samples with the unsound kernel rate of≤6.0%,accounting for 61.3%of the total samples;there were 7 samples with the unsound kernel rate of≥10.0%,accounting for 11.3%of the total samples.The variation range of 1 000-grain weight was 31.8-51.2 g with an average of 41.6 g.The moisture content of grains varied from 10.7%to 13.0%,with an average of 11.8%(Table 1).
| 图表编号 | XD00182605600 严禁用于非法目的 |
|---|---|
| 绘制时间 | 2018.07.01 |
| 作者 | Qiqi ZHANG、Yingxiu WAN、Wenxin CAO、Yan LI、Yao LI、Pingzhi ZHANG |
| 绘制单位 | Institute of Crops,Anhui Academy of Agricultural Sciences、Hefei Branch,National Wheat Improvement Center、Institute of Crops,Anhui Academy of Agricultural Sciences、Hefei Branch,National Wheat Improvement Center、Institute of Crops,Anhui Academy of Agricultu |
| 更多格式 | 高清、无水印(增值服务) |
查看“Table 2 Average quality index of samples from different areas”的人还看了
-

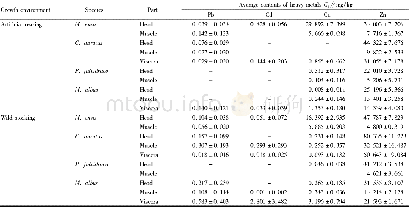
- Table 2 Average contents of heavy metals in different parts of aquatic products from Lake Taihu (±s, n=24)


