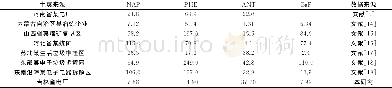
《Table 3 Comparison of China’s graphite consumption structure in 2014 and 2017》
 提示:宽带有限、当前游客访问压缩模式
本系列图表出处文件名:随高清版一同展现
《China's Graphite Resources and the Supply-Demand Situation》
From 2014 to 2017,the output of crystalline graphite in China was generally stable,and was basically maintained at 60–70 tons per year.The output of cryptocrystalline graphite increased from 0.25 million tons in 2014 to 0.50million tons in 2017,with an average annual increase of25%(Table 1).
| 图表编号 | XD0017179700 严禁用于非法目的 |
|---|---|
| 绘制时间 | 2018.08.01 |
| 作者 | LIU Lian、LIU Zhiqiang、HUANG Min、FEI Hongcai、ZHOU Jian、ZHANG Yuxu、HAO Ziguo |
| 绘制单位 | Chinese Academy of Geological Sciences,China Geological Society、Chinese Academy of Geological Sciences,China Geological Society、Chinese Academy of Geological Sciences,China Geological Society、Chinese Academy of Geological Sciences,China Geological Society |
| 更多格式 | 高清、无水印(增值服务) |

