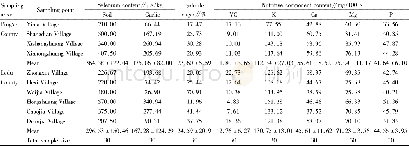
《Table 4 Mass water content of soil in May 2018(partly)》
 提示:宽带有限、当前游客访问压缩模式
本系列图表出处文件名:随高清版一同展现
《陇东黄土高原中沟小流域土壤水分实测数据集(2018)》
During the growing season from May to October,the soil moisture of Robinia pseudoacacia plantations with different densities is showed as follows(Tables 3,4):1,600 trees/hm2(18.75%)>2,196 trees/hm2(15.93%)>750 trees/hm2(15.92%)>4,563 trees/hm2(11.87%).Soil moisture in different topographic locations:soil moisture was the best for the Robinia pseudoacacia forest in the tableland surface(upper),in the middle for the Robinia pseudoacacia forests in the tableland surface(lower)and the ditch,and the worst for the Robinia pseudoacacia forest in the beam.As far as slope aspect was concerned,soil moisture was the best in shady slope,followed by the semi-shady slope and sunny slope,and was the worst in semi-sunny slope.As far as the vertical variation of soil moisture was concerned,soil moisture was usually the largest in the surface layer,decreased with the deepening of the soil layer and then tended to be stable.For different topographic locations,the variation coefficient of soil moisture between different layers for Robinia pseudoacacia forest on the tableland(upper)was the smallest,with the soil moisture relatively stable,followed by Robinia pseudoacacia forests on the tableland surface(lower)and on the gully,and was the largest for the Robinia pseudoacacia forest on the beam,with a rapid variation layer reaching 90 cm.For the slope direction:the change of soil moisture in sunny slope and semi-sunny slope was more active than that in shady slope and semi-cloudy slope,in which the sunny slope was more stable than the semi-sunny slope and the shady slope was more stable than the semi-cloudy slope[17].
| 图表编号 | XD00168619000 严禁用于非法目的 |
|---|---|
| 绘制时间 | 2019.12.24 |
| 作者 | 张军、邸利、李小英、陈徵尼、黄海霞、王安民、任艺彬、方书敏、汝海丽、景贯阳、张晓梅、费俊娥 |
| 绘制单位 | 甘肃农业大学资源与环境学院、甘肃农业大学资源与环境学院、兰州大学资源与环境学院、甘肃林业科学研究所、甘肃农业大学林学院、平凉市水土保持科学研究所、陇东学院农林科技学院、甘肃农业大学资源与环境学院、平凉市水土保持科学研究所、甘肃农业大学资源与环境学院、甘肃农业大学资源与环境学院、甘肃农业大学资源与环境学院 |
| 更多格式 | 高清、无水印(增值服务) |
查看“Table 4 Mass water content of soil in May 2018(partly)”的人还看了
-

- Table 4 Distribution characteristics of soil available phosphorus content in the Nandu River Basin of Hainan Province


