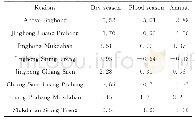
《Tab.4 Mann-Kendall test values of maximum and minimum flow in 1-day、3-day and 7-day at each station
The maximum 1-day,3-day,and 7-day flow and the minimum 1-day,3-day and 7-day flow at Chiang Saen station showed a decreasing trend,but the trend value of maximum flow was larger than the corresponding minimum flow,indicating that the flow fluctuation interval gradually decreased.At Luang Prabang station,the maximum 1-day,3-day,and 7-day flow and the minimum 1-day,3-day,and 7-day flow all showed a decreasing trend.A-mong them,the minimum 1-day,3-day,and 7-day flow decreased significantly,indicating that the flow fluctuation interval was gradually increasing.The maximum 1-day,3-day,and 7-day flow and the minimum 1-day,3-day and 7-day flow at Mukdahan station showed a decreasing trend.Among them,the minimum 1-day,3-day,and 7-day flow increased significantly,indicating that the flow fluctuation interval gradually decreased.Stung Treng′s station maximum 1-day,3-day and 7-day flow showed a decreasing trend,while the minimum 1-day,3-day,and 7-day all showed an increasing trend,indicating that the flow fluctuation interval gradually decreased.
| 图表编号 | XD00136766500 严禁用于非法目的 |
|---|---|
| 绘制时间 | 2020.02.01 |
| 作者 | 孙周亮、刘艳丽、刘冀、唐雄朋、舒章康、关铁生 |
| 绘制单位 | 南京水利科学研究院水文水资源与水利工程科学国家重点实验室、水利部应对气候变化研究心、武汉大学水资源与水电工程科学国家重点实验室、南京水利科学研究院水文水资源与水利工程科学国家重点实验室、水利部应对气候变化研究心、三峡大学水利与环境学院、南京水利科学研究院水文水资源与水利工程科学国家重点实验室、水利部应对气候变化研究心、南京水利科学研究院水文水资源与水利工程科学国家重点实验室、水利部应对气候变化研究心、南京水利科学研究院水文水资源与水利工程科学国家重点实验室、水利部应对气候变化研究心 |
| 更多格式 | 高清、无水印(增值服务) |
查看“Tab.4 Mann-Kendall test values of maximum and minimum flow in 1-day、3-day and 7-day at each station”的人还看了
-

- Tab.1 Mann-Kendall and Pettit test values of annual runoff and CVat each station(Note:the year in which the mutation occ
 提示:宽带有限、当前游客访问压缩模式


