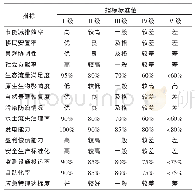
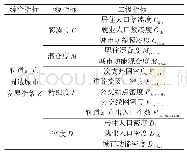
《表7.样本站点综合信息评价(绿色标注为指标超过截尾均值)》
 提示:宽带有限、当前游客访问压缩模式
本系列图表出处文件名:随高清版一同展现
《亚洲大城市中心区轨道交通站点影响域移动性研究——以中日韩新四国代表城市为例》
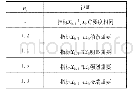
The extreme data was removed by using the truncated mean method.The average value of integration(HH)is0.40,while the integration R3 is 1.31 and the mean depth is19.96.From the three quantitative data,it can be concludedthat the integration values of most stations are within the range of 0.3–0.5,which is a more suitable interval.If the value is too small,the streets will be too curved,otherwise,the spatial arrangement of streets will be single.When the area integration is balanced,most values are between 1.2and 1.4,it can be seen that the partial spatial integration and reasonable spatial conductivity are realized in most stations.Chongqing is a special case,where the integration of Lianglukou station is the lowest because the spatial conductivity is weak,which is caused by the terrain with huge elevation difference and some buildings with great height.The opposing situation happens in Tokyo,where high integration of streets,appropriate height of buildings and strong spatial conductivity lead to the single spatial arrangement of streets.Finally,most data of mean depth are around 18–22,which is a suitable range(Table 6).
| 图表编号 | XD00135404600 严禁用于非法目的 |
|---|---|
| 绘制时间 | 2019.09.01 |
| 作者 | 褚冬竹、丁洪亚、阳蕊、龚凌菲 |
| 绘制单位 | 重庆大学建筑城规学院、中国建筑西南设计研究院有限公司设计三院、重庆大学建筑城规学院 |
| 更多格式 | 高清、无水印(增值服务) |
