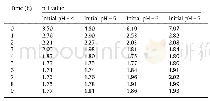
《Table 2 Changes in pH during the DNAN degradation processes under different initial pH.》
Tables 2 and 3 show the changes in pH during the oxidation processes under different initial pH and H2O2dosages.The results show that the pH decreased quickly when the oxidation process of DNAN began,regardless of the initial pH and H2O2dosage,and remained constant at about 2 after the DNAN degradation processes finished.This finding indicates that some acid substances—mostly HNO3—were formed as a result of DNAN degradation.
| 图表编号 | XD00131543300 严禁用于非法目的 |
|---|---|
| 绘制时间 | 2019.10.01 |
| 作者 | 苏海磊、Christos Christodoulatos、Benjamin Smolinski、Per Arienti、Greg O'Connor、孟晓光 |
| 绘制单位 | Center for Environmental Systems, Stevens Institute of Technology、Center for Environmental Systems, Stevens Institute of Technology、US Army RDECOM-ARDEC、US Army RDECOM-ARDEC、US Army RDECOM-ARDEC、Center for Environmental Systems, Stevens Institute of Techn |
| 更多格式 | 高清、无水印(增值服务) |
 提示:宽带有限、当前游客访问压缩模式


