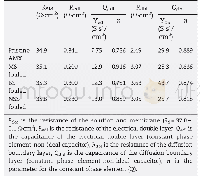
《Table 1 EIS fitting results of the AZ31 samples measured in neutral 3.5 wt%Na Cl solution》
 提示:宽带有限、当前游客访问压缩模式
本系列图表出处文件名:随高清版一同展现
《织构对基于Mg-3Al-1Zn合金的镁空气电池性能的影响(英文)》
Fig.2 shows the optical microscopic images of the RS and CS surfaces.It can be found that the RS and CS surface exhibit an almost identical grain size distribution,with an average grain size of 25.0 and 25.1μm,respectively.Thus,the grain size difference is not responsible for the corrosion and discharge performance difference in this study.Fig.3 displays the EIS plots of the RS and CS surfaces.Both of the plots consist of a capacitive loop at high frequency and a relatively-small capacitive loop at low frequency.The high frequency capacitive loop is resulted from charge transfer and a film effect,and the low frequency capacitive loop is resulted from a mass transport relaxation in the surface layer[17,18].The equivalent circuits of the EIS plots are shown in Fig.4.A constant-phase element representing a shift from an ideal capacitor was used instead of the capacitance itself,for simplicity.In Fig.4,Rs represents the solution resistance,CPEdl represents the electric double layer capacity,Rt represents the charge transfer resistance,CPEf represents the film capacity and Rf represents the film resistance.The EIS fitting results are listed in Table 1.The reciprocal of Rt reflects the corrosion resistance of the RS and CS samples,which is 180.5 and 242.4Ω·cm2,respectively.The results demonstrate that the CS surface has a higher corrosion resistance compared with the RS surface.
| 图表编号 | XD0011229000 严禁用于非法目的 |
|---|---|
| 绘制时间 | 2018.04.01 |
| 作者 | 赵炎春、黄光胜、张诚、陈琳、韩廷状、潘复生 |
| 绘制单位 | 重庆大学材料科学与工程学院、重庆大学国家镁合金材料工程技术研究中心、重庆大学材料科学与工程学院、重庆大学国家镁合金材料工程技术研究中心、重庆大学机械传动国家重点实验室、重庆大学材料科学与工程学院、重庆大学国家镁合金材料工程技术研究中心、重庆大学材料科学与工程学院、重庆大学国家镁合金材料工程技术研究中心、重庆大学材料科学与工程学院、重庆大学国家镁合金材料工程技术研究中心、重庆大学材料科学与工程学院、重庆大学国家镁合金材料工程技术研究中心、重庆大学机械传动国家重点实验室 |
| 更多格式 | 高清、无水印(增值服务) |


