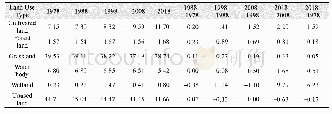
《Table 4 Urban cell ratio of Moore neighborhood in different resolution[14]》
![《Table 4 Urban cell ratio of Moore neighborhood in different resolution[14]》](http://bookimg.mtoou.info/tubiao/gif/QQSJ201903009_05600.gif) 提示:宽带有限、当前游客访问压缩模式
提示:宽带有限、当前游客访问压缩模式
本系列图表出处文件名:随高清版一同展现
《"广州市番禺区土地利用及空间距离数据集(1999,2008)"》
Results showed that with the increase of spatial scale,the ratio of high urban cells(such as,count is 8 or 7)decreased in 1999 and 2008(Table 4).This suggests that urban development density decreases from high to low by downscaling.It can also be seen from the table that urban cells of 1,2,3,and 4 were continuously increased by downscaling.However,the ratio of urban cells(count are 6,7,and 8)in neighborhood had a tendency to be declined.
| 图表编号 | XD00110333000 严禁用于非法目的 |
|---|---|
| 绘制时间 | 2019.09.25 |
| 作者 | 张亦汉、乔纪纲 |
| 绘制单位 | 广东财经大学地理与旅游学院、广东财经大学地理与旅游学院 |
| 更多格式 | 高清、无水印(增值服务) |
