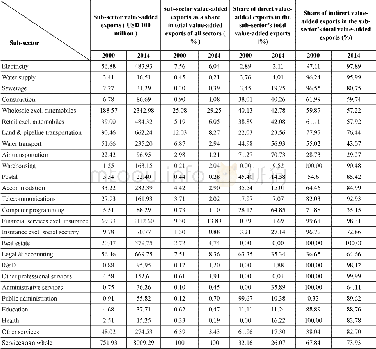
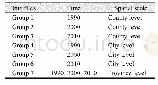
《Table 6:Change in China’s Service Value-added Exports, 2000~2014》
 提示:宽带有限、当前游客访问压缩模式
本系列图表出处文件名:随高清版一同展现
《Re-Evaluation of China's Service Trade Competitiveness: A Global Value Chain Perspective》
Notes:The sum of direct and indirect value-added export shares for a sub-sector is 100%.Source:Calculated based on WIOD data.
Given the heterogeneity of service sectors,we employ the forward decomposition method to further estimate the value-added exports of China’s 25 service sub-sectors and their trends(see Table 6).Our findings suggest that China’s 25 service sub-sectors all experienced rapid growth in their foreign trade volume.Service exports are concentrated in a few sectors,including wholesale(excluding vehicles),financial services(excluding insurance)and legal&accounting services.In addition,only 30%of service exports occurred directly through service sectors,and this ratio continues to fall.This implies that more value of services,particularly high-tech services essential to manufacturing transition and GVC location upgrade,is indirectly exported to other countries.These services are also known as producer services,which link various specialized manufacturing processes with services to increase a country’s economic efficiency.As industries become more closely interrelated than ever in the context of GVC,the value of R&D,IT and management services is extensively embedded as intermediate inputs in the finished goods that are finally exported.The boundary between manufacturing and services is increasingly blurred,and the role of services in foreign trade is significantly underestimated(Cheng,2008).
| 图表编号 | XD007222300 严禁用于非法目的 |
|---|---|
| 绘制时间 | 2018.05.08 |
| 作者 | 程大中、郑乐凯、魏如青 |
| 绘制单位 | Department of World Economy and Institute for World Economy, Fudan University、Department of World Economy, Fudan University、Department of World Economy, Fudan University |
| 更多格式 | 高清、无水印(增值服务) |