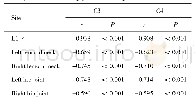
《Table 2.Changes in eGFR when 24-h UPE<or≥1.5 g in CKD Patients at Three Periods[mL·min-1·1.73 m-
 提示:宽带有限、当前游客访问压缩模式
本系列图表出处文件名:随高清版一同展现
《"Effects of Niaoduqing Particles(尿毒清颗粒)on Delaying Progression of Renal Dysfunction:A Post-trial,Open-Label,Follow-up Study"》
Notes:Because of missing values,the number of participants were not equal in 24-h UPE to total number of FAS.UPE,urinary protein excretion;IQR,interquartile range;eGFR,estimated glomerular filtration rate;P<0.05 vs.placebo group;△P<0.05,△△P<0.01,c
We also analyzed the changes in eGFR in the subgroups relative to baseline eGFR,after grouping according to 24-h UPE<1.5 g or 1.5 g(Table 2).In the subgroups of 24-h UPE<1.5 g,there was no difference in e GFR at baseline,24 and 48 weeks(P=0.801,0.210and 0.195,respectively).After 24-week treatment,the median e GFR in the Niaoduqing group were not different from baseline(P=0.485),but decreased in the placebo group(P=0.011).After 48-week treatment,the median e GFR was not different from baseline in the Niaoduqing group(P=0.645),but decreased significantly from baseline in the placebo group(P<0.001).At 48 weeks,e GFR changes from baseline was significant different between the two groups(P=0.024).Although there was no statistical difference in eGFR changes in the two groups between 24 and 48 weeks(P=0.893),e GFR in the placebo group deceased significantly from 24 weeks(P=0.036),and no change in the Niaoduqing group was observed(P=0.087).
| 图表编号 | XD0064291800 严禁用于非法目的 |
|---|---|
| 绘制时间 | 2019.03.01 |
| 作者 | ZHENG Ying、WANG Nian-song、LIU Yu-ning、HE Li-qun、JIAN Gui-hua、LIU Xu-sheng、NI Zhao-hui、CHENG Xiao-hong、LIN Hong-li、ZHOU Wen-hua、WANG Ya-ping、FANG Jing-ai、HE Ya-ni、YANG Hong-tao、ZHAO Li-juan、DING Han-lu、WANG Li-hua、YU Ren-huan、LI Wen-ge、YE Zhi-ming、GUO Wang |
| 绘制单位 | Department of Nephrology, Chinese People's Liberation Army General Hospital, Chinese People's Liberation Army Institute of Nephrology, State Key Laboratory of Kidney Diseases (2011DAV00088), National Clinical Research Center for Kidney Diseases、Departme |
| 更多格式 | 高清、无水印(增值服务) |
查看“Table 2.Changes in eGFR when 24-h UPE
-

- 表5 239例结核分枝杆菌感染的患者耐多药多因素Logistics分析Table 5 The multifactor logistic analysis of MDR-TB in 239 patients with mycobacteriu
-
![Table 1Immunization scheme in Brazil from March 2017, according to the characteristics of the patients[56, 57].](//bookimg.mtoou.info/tubiao/gif/YTRY201902002_27200.gif)
- Table 1Immunization scheme in Brazil from March 2017, according to the characteristics of the patients[56, 57].
-

- 表5 239例结核分枝杆菌感染的患者耐多药多因素Logistics分析Table 5 The multifactor logistic analysis of MDR-TB in 239 patients with mycobacteriu
-
![Table 1Immunization scheme in Brazil from March 2017, according to the characteristics of the patients[56, 57].](//bookimg.mtoou.info/tubiao/gif/YTRY201902002_27200.gif)
- Table 1Immunization scheme in Brazil from March 2017, according to the characteristics of the patients[56, 57].


![Table 1Immunization scheme in Brazil from March 2017, according to the characteristics of the patients[56, 57].](http://bookimg.mtoou.info/tubiao/gif/YTRY201902002_27200.gif)

