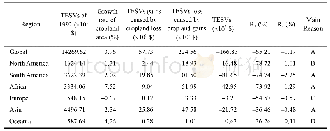
《Table 2 Changes in TESVs caused by cropland changes at a global level, 1992–2015》
 提示:宽带有限、当前游客访问压缩模式
本系列图表出处文件名:随高清版一同展现
《1992-2015年全球耕地变化对陆地生态系统服务价值的影响(英文)》
The total global TESVs of 1992 were$14.27 trillion.Asia took up 31.64%of the global TESVs,ranking the first place,followed by South America and Africa,accounting for25.49%and 23.46%respectively.A reduction of TESVs caused by cropland conversion was$166.82 billion,equaled to 1.17%of the total TESVs in 1992.In the changing areas correlated to cropland,the TESVs decreased by 65.21%globally.From the detailed calculation,it can be seen that conversion of tropical forest to cropland is the main reason for the decrease of TESVs(Table 2),up to$187.47 billion,which exceeded the net reduction caused by cropland conversion.Previous studies have also shown that tropical forests were the primary sources of new cropland in the 1980s and 1990s,which were mainly distributed in South America,Sub-Saharan Africa,and Southeast Asia(Gibbs et al.,2010).Among the 17 ecosystem services,the ESVs of nutrient cycling decreased largely($63.94 billion).Only the ESVs of biological control increased a little,about$1.37 billion.
| 图表编号 | XD0047166500 严禁用于非法目的 |
|---|---|
| 绘制时间 | 2019.03.01 |
| 作者 | 李圆圆、谈明洪、郝海广 |
| 绘制单位 | Key Laboratory of Land Surface Pattern and Simulation, Institute of Geographic Sciences and Natural Resources Research, CAS、International College, University of Chinese Academy of Sciences、State Key Laboratory of Environmental Criteria and Risk Assessment |
| 更多格式 | 高清、无水印(增值服务) |


![Table 2.Changes in eGFR when 24-h UPE<or≥1.5 g in CKD Patients at Three Periods[mL·min-1·1.73 m-2, Median (IQR) ]](http://bookimg.mtoou.info/tubiao/gif/ZXYY201903002_08400.gif)


