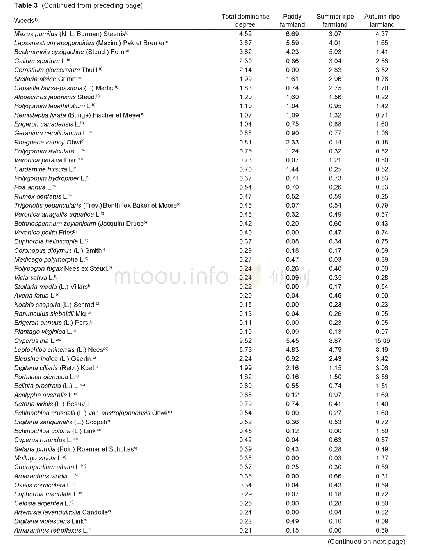
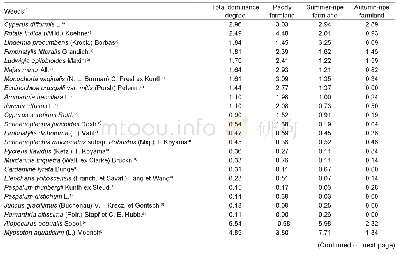
《Table 2 Numbers of counties with different types of farmland area changes》
 提示:宽带有限、当前游客访问压缩模式
本系列图表出处文件名:随高清版一同展现
《中国山区耕地利用边际化过程机理——基于成本和收益变化的分析(英文)》
From 1990 to 2000,there were 468 MCs with a net decrease of farmland,accounting for52%of the total number of MCs,while the proportions of counties with a net decrease of farmland in PCs and HCs were 71%and 56%,respectively.The high proportion of net decrease in PCs was caused by massive construction land expansion in the coastal plain areas.During 2000–2010,the changes of cultivated land in PCs were similar to those in the previous decade,and the number of counties with a net decrease of farmland increased by 61,with the proportion increasing to 78%.However,the number in MCs and HCs increased significantly,especially in MCs,where the number increased from 468 to 712 and the proportion expanded to 79%.Correspondingly,the number of MCs with a net increase of farmland decreased from 411 to 114(Table 2).Overall,since 2000,the reduction of farmland in MCs of China is more evident than in HCs and PCs.
| 图表编号 | XD0062092500 严禁用于非法目的 |
|---|---|
| 绘制时间 | 2019.04.01 |
| 作者 | 李升发、李秀彬 |
| 绘制单位 | Guangdong Open Laboratory of Geospatial Information Technology and Application,Guangzhou Institute of Geography、Key Laboratory of Land Surface Pattern and Simulation,Institute of Geographic Sciences and Natural Resources Research,CAS、University of Chinese |
| 更多格式 | 高清、无水印(增值服务) |


