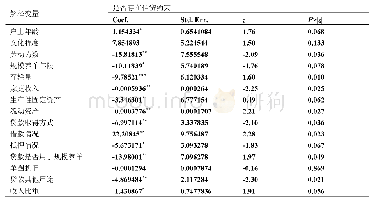
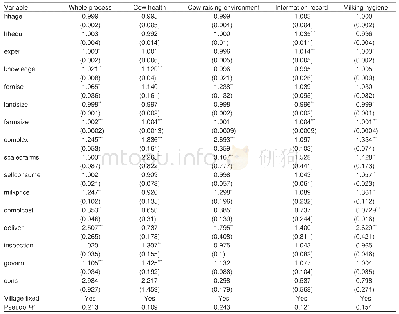
《Table 6 Regression results of factors influencing the adoption of food safety measures using count
 提示:宽带有限、当前游客访问压缩模式
本系列图表出处文件名:随高清版一同展现
《Factors affecting the adoption of on-farm milk safety measures in Northern China-An examination from the perspective of farm size and production type》
For each variable,the number of the first row is incidence rate ratio(IRR).Data in parentheses indicate robust standard error.*,**,and***,significant at 10,5,and 1%,respectively.
Empirical results of the whole production progress and each component are presented in Table 6.Overall,the pseudo R2 from the Poisson regression model ranged from 0.109to 0.243.Considering the nature of the cross sectional data,the magnitudes of pseudo R2 are considered to be reasonable and comparable with other studies.The signs and magnitudes of the estimated coefficients of the key variables,such as milk price,compliance cost,production types,and farming scale,are consistent with our priori expectation.
| 图表编号 | XD0047434700 严禁用于非法目的 |
|---|---|
| 绘制时间 | 2019.02.20 |
| 作者 | YANG Xin-ran、Kevin Z.Chen、KONG Xiang-zhi |
| 绘制单位 | Institute of Agricultural Economics and Development, Chinese Academy of Agricultural Sciences、China Academy for Rural Development, Zhejiang University、International Food Policy Research Institute、School of Agricultural Economics and Rural Development, Ren |
| 更多格式 | 高清、无水印(增值服务) |
查看“Table 6 Regression results of factors influencing the adoption of food safety measures using count data model”的人还看了
-
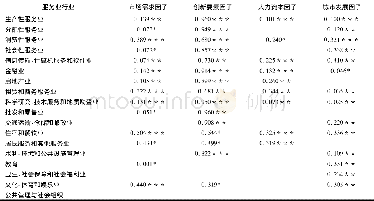
- 表6 各影响因素对服务业集聚的回归结果Table 6 Regression results of various influencing factors on service industry agglomeration
-

- Table 4 Regression analysis of influence factors and implementation willingness of agricultural management enterprises


