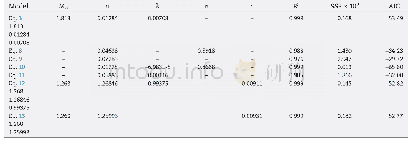
《Table 2 Semi-variogram models and their parameters for soil nutrients》
 提示:宽带有限、当前游客访问压缩模式
本系列图表出处文件名:随高清版一同展现
《"Spatial variability of soil total nitrogen,phosphorus and potassium in Renshou County of Sichuan Basin,China"》
1) TN,total nitrogen;TP,total phosphorus;TK,total potassium.
The best-fitted models and their parameters for matching the experimental semi-variograms are listed in Table 2.The best-fitted model for TP was a spherical model,while the models for TN and TK were both exponential models.The R2 value of the semi-variogram model for TN was 0.79and the values for TP and TK exceeded 0.9,suggesting the spatial structures of the three soil nutrients were well-fitted with the selected semi-variogram models.
| 图表编号 | XD0047430300 严禁用于非法目的 |
|---|---|
| 绘制时间 | 2019.02.20 |
| 作者 | GAO Xue-song、XIAO Yi、DENG Liang-ji、LI Qi-quan、WANG Chang-quan、LI Bing、DENG Ou-ping、ZENG Min |
| 绘制单位 | College of Resources, Sichuan Agricultural University、College of Resources, Sichuan Agricultural University、College of Resources, Sichuan Agricultural University、College of Resources, Sichuan Agricultural University、College of Resources, Sichuan Agricultu |
| 更多格式 | 高清、无水印(增值服务) |
查看“Table 2 Semi-variogram models and their parameters for soil nutrients”的人还看了
-

- Table 2–Estimated parameters, SSR and AIC values for the models, when membranes were loaded with 29 wt%Prg.
-

- Table 4 Adsorption kinetics parameters for Pseudo-first-order model and Pseudosecond-order model of Ni2+on HBCx


