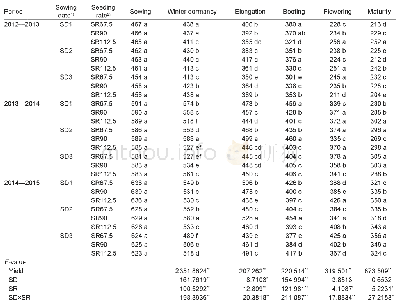
《Table 3 Effects of sowing date (SD) and seeding rate (SR) on soil water storage at different plant
 提示:宽带有限、当前游客访问压缩模式
本系列图表出处文件名:随高清版一同展现
《"Optimization of sowing date and seeding rate for high winter wheat yield based on pre-winter plant development and soil water usage in the Loess Plateau,China"》
1) SD1,SD2,and SD3,sowing dates on 20 September,1 October,and 10 October,respectively.2) SR67.5,SR90,and SR112.5,three seeding rates of 67.5,90,and 112.5 kg ha–1,respectively.The values within a column in each growing season are not significan
The lowest soil water storage at 0–300 cm at sowing(450–470 mm)was observed in 2012–2013,and the highest(620–640 mm)was observed in 2014–2015(Table 3).The differences in soil water storage at sowing stage among the three seasons were solely due to the precipitation in the summer fallow period(Fig.1).The precipitation in the summer fallow period was the lowest(171 mm)in2012–2013,in the middle(284 mm)in 2013–2014,and the highest(366 mm)in 2014–2015(Fig.1).Soil water consumption from winter dormancy to booting stages is linked to the formation of tiller number and grain number per spike,and the amount of soil water that remains after booting is critical for grain filling(Yang et al.2004).Therefore,reductions in soil water were calculated for these two growth periods(Fig.3).The soil water reduction from winter dormancy to booting stages was similar between SD1 and SD2 in 2012–2013 and 2013–2014,but the further delay in sowing stage to SD3 in 2012–2013 and2013–2014 increased soil water consumption(Fig.3-A).The average soil water reduction for all three seeding rates at SD3 was 13–22 mm higher than that at SD1 and SD2,leading to higher soil water storage in SD1 and SD2than that in SD3(Table 3).The trend of soil water loss in2014–2015 was different from that observed in 2012–2013or 2013–2014(Fig.3-A).In 2014–2015,the soil water reduction was the highest at SD2 and the lowest at SD3,while the soil water reduction at SD1 was in the middle(Fig.3-A).In contrast,the increase in seeding rate from SR67.5 to SR112.5 had variable effects on soil water reduction from winter dormancy to booting stages among different sowing dates in the three seasons(Fig.3-A).The treatment with the highest soil water reduction varied in each season(SR67.5 at SD3 in 2012–2013,SR112.5 at SD3 in 2013–2014,and SR67.5 at SD2 in 2014–2015).Furthermore,the soil water reduction from winter dormancy to booting stages at SD2 was the lowest at SR90 in two seasons(2012–2013 and 2014–2015),whereas at SD2in 2013–2014,soil water reduction at SR90 was slightly higher than that at SR67.5 or SR112.5(Fig.3-A).
| 图表编号 | XD0047424300 严禁用于非法目的 |
|---|---|
| 绘制时间 | 2019.01.20 |
| 作者 | REN Ai-xia、SUN Min、WANG Pei-ru、XUE Ling-zhu、LEI Miao-miao、XUE Jian-fu、GAO Zhi-qiang、YANG Zhen-ping |
| 绘制单位 | College of Agriculture,Shanxi Agricultural University、College of Agriculture,Shanxi Agricultural University、College of Agriculture,Shanxi Agricultural University、College of Agriculture,Shanxi Agricultural University、College of Agriculture,Shanxi Agricultu |
| 更多格式 | 高清、无水印(增值服务) |
查看“Table 3 Effects of sowing date (SD) and seeding rate (SR) on soil water storage at different plant growth stages”的人还看了
-

- Table 1 Effects of 1-MCP treatment following hypoxic hypobaria (HH) on respiration rate and ethylene production of papay
-

- Table 3 Effects of electric field treatment of seed on physiological and biochemical indexes of seedlings
-

- Table 1Effects of colchicine concentration and treatment time on sur-vival rate and regeneration of L.edulis
-

- 表2 不同播期播量组合对百农207穗部性状的影响Tab.2 Effect of sowing date and seeding amount combination on spike characteristics of new wheat


