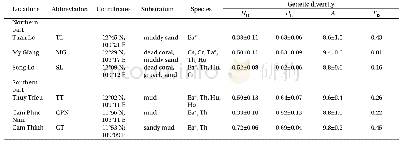
《Table 1 Estimates of genetic diversity of the Greylag Goose populations》
 提示:宽带有限、当前游客访问压缩模式
本系列图表出处文件名:随高清版一同展现
《Conservation genetics of a resident population of Greylag Goose(Anser anser) at the southernmost limit of the species' distribution in Europe》
Values for populations 1-6 were recalculated from Pellegrino et al.(2015),only for the loci we used in this study.Number of genotyped individuals(n)and the type of site they were collected from,number of alleles per locus(A),number of effective al
All 51 individuals sequenced were found to be monomorphic in the amplified fragment of the CR,providing a single haplotype.After comparison with published studies,our sequence was identified as the haplotype E7 that was only found in birds from Prespa Lakes in Heikkinen et al.(2015).All microsatellite markers were found to be polymorphic in the population and the number of alleles per locus ranged from two(loci Aph19,Hhiμ1b)to nine(locus Ans02;Additional file 1:Table S2).Two of the loci(Ans07,Ans18)were omitted from further analyses due to the presence of null alleles.The remaining nine loci did not deviate from Hardy–Weinberg proportions(adjusted p-value=0.006)and no LD was detected between any of them.The Bayesian clustering method implemented in Structure proposed the presence of a single genetic cluster(K=1)in the dataset,suggesting the absence of any population substructure(Additional file 1:Table S4).Likewise,the FCA did not show any distinct clustering pattern of individuals,neither between age classes nor between sexes(Fig.2),further enhancing the hypothesis of a rather panmictic population.However,two individuals appeared as outliers:both were males but belonged to different age classes.The population showed medium to low levels of genetic diversity,with a mean Ho of 0.45,Fis of 0.15 and the number of effective alleles(Ae)estimated at 2.3.Genetic diversity indices for each locus are presented in Additional file 1:Table S5.Comparison of these estimates with published values of diversity for other European populations(Table 1),indicates that Prespa population exhibits similar levels of diversity with other breeding populations,but lower levels from populations that consist of individuals gathering at wintering sites(Table 1).For all individuals,standardized multilocus heterozygosity ranged from 0.25 to 1.72 whereas all three fitness traits(especially body size and condition)showed high variation(Additional file 1:Table S3).We did not find any evidence of identity disequilibrium in the population as g2 was not significant(0.02,95%CIs:-0.01 to0.06,p=0.12).As expected,since there is no variance in inbreeding,no HFCs emerged in our dataset:sMLH had no effect on body size(p=0.79),condition(p=0.06)or foraging efficiency(p=0.26).
| 图表编号 | XD0047412800 严禁用于非法目的 |
|---|---|
| 绘制时间 | 2019.03.01 |
| 作者 | Anastasios Bounas、Giorgos Catsadorakis、Annita Logotheti、Berend Voslamber、Antonios Magoulas、Dimitris Tsaparis |
| 绘制单位 | Molecular Ecology and Conservation Genetics Lab,Department of Biological Applications and Technology,University of Ioannina、Society for the Protection of Prespa、Society for the Protection of Prespa、Sovon Dutch Centre for Field Ornithology、Institute of Mar |
| 更多格式 | 高清、无水印(增值服务) |
查看“Table 1 Estimates of genetic diversity of the Greylag Goose populations”的人还看了
-

- 表3 角倍蚜干雌和越冬若蚜的遗传多样性分析Tab.3 Genetic diversity of the fundatrigeniae and overwintering larvae of S.chinensis
-

- Table 2 The codes and sequence of SRAP prim ers used in genetic diversity analysis of Sclerotinia sclerotiorum derived f


