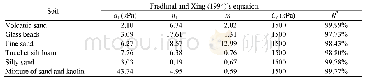
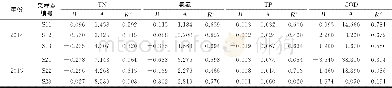
《Table 2 Fitting parameters obtained by best fitting Eq. (11) on experimental data of relative coeff
 提示:宽带有限、当前游客访问压缩模式
本系列图表出处文件名:随高清版一同展现
《孔径分布函数对水分在非饱和土体中迁移的作用(英文)》
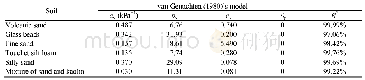
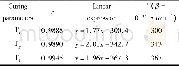
The fitting parameters such as af,nf,and mf in Fredlund and Xing(1994)’s equation and av,bv,and cv in van Genuchten(1980)’s model were obtained from the best fit procedure(by minimizing (50)(log(kri)-log(k?ri)) 2,where kri is the measured relative hydraulic conductivity and k?ri is the estimated relative hydraulic conductivity from Eq.(11)or Eq.(13)) ,which are as presented in Tables 2 and 3,respectively.The best fitting results for the relative hydraulic conductivity for these soils are illustrated in Fig.10.Subsequently,the determined fitting parameters in Tables 2and 3 were used to estimate the SWCC for these soils and the estimation results are illustrated in Fig.11.The coefficients of goodness between the estimated results and the experimental results of SWCC for these soils are presented in Table 4.
| 图表编号 | XD0046971300 严禁用于非法目的 |
|---|---|
| 绘制时间 | 2019.01.03 |
| 作者 | Qian ZHAI、Harianto RAHARDJO、Alfrendo SATYANAGA、PRIONO、Guo-liang DAI |
| 绘制单位 | The State Key Laboratory for Reinforcement Concrete and Prestress Reinforcement Concrete Structures of the Ministry of Education,Southeast University、School of Civil and Environmental Engineering, Nanyang Technological University、School of Civil and Envir |
| 更多格式 | 高清、无水印(增值服务) |
