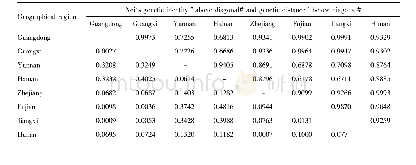
《Table 2.Matrix of genetic distances (FST) among populations of Enhalus acoroides calculated by usin
 提示:宽带有限、当前游客访问压缩模式
本系列图表出处文件名:随高清版一同展现
《"Assessment by microsatellite analysis of genetic diversity and population structure of Enhalus acoroides from the coast of Khanh Hoa Province, Vietnam"》
Note:*Significant different atα=0.05,p-value<0.01.See legend in Fig.1 for the abbreviation of the locations.
The related low genetic difference was detected among populations with an overall FST value of 0.25.The pairwise genetic differentiation depicted that the highest genetic differentiation was found between MG and SL(FST=0.47,p-value<0.01)whereas these values were lowest among populations growing in lagoon including the TT,CPN and CT sites(pairwise FST<0.06,pvalue>0.1)(Table 2) .The results of structure analysis indicated that six populations formed two clusters,one including the open sea populations(TL,MG and SL:open sea cluster 1)and one including the lagoon populations(TT,CPN and CT:lagoon cluster2)(Fig.2,Panel A) by both methods.The largest variation of value L(K)was observed at K=2 according to the method of Rosenberg et al.(2001)and the highestΔK was also found at K=2according to the method of Evanno et al.(2005)(data not shown) .The cluster analysis also showed that six populations separated into two main clades including open sea(TL,MG and SL)and lagoon(TT,CPN and CT)(Fig.2,Panel B) .The results of AMOVA showed 9.5%(p-value<0.01)of variation between the two clusters.The percentages of variation among populations within populations were 15.6(p-value<0.01)and 74.2%(pvalue>0.1),respectively(Table 3).The isolation-by-distance parameter resulting from pairwise plotting of FST values against the geographic distance(km)was generated using the Mantel test for all regions.The Mantel test showed no significant isolation by distance at a significance level of 95%.The mantel r statistic of 0.41 indicates that there is a relatively low positive correlation between genetic and geographic distance.However,these results are not statistically significant atα=0.05(Fig.3).
| 图表编号 | XD0040194500 严禁用于非法目的 |
|---|---|
| 绘制时间 | 2019.01.01 |
| 作者 | Xuan-Vy Nguyen、Papenbrock Jutta |
| 绘制单位 | Department of Marine Botany, Institute of Oceanography, Vietnam Academy of Science and Technology、Graduate University of Science and Technology、Institute of Botany, Leibniz University Hannover |
| 更多格式 | 高清、无水印(增值服务) |
查看“Table 2.Matrix of genetic distances (FST) among populations of Enhalus acoroides calculated by using Arlequin 3.5 (Excof”的人还看了
-

- Table 4 Nei's genetic identity and genetic distance of‘Candidatus Liberibacter asiaticus’from eight provinces in southe
-

- 表2 我国东北地区分布的9个鼩鼱属物种的遗传距离Tab.2 The K2P genetic distance among 9 species of Sorex from Northeast China


