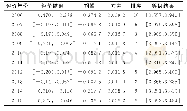
《Table 4 Comprehensive assessment results of water resources for the China mainland》
 提示:宽带有限、当前游客访问压缩模式
本系列图表出处文件名:随高清版一同展现
《水资源可持续承载力的概念与实证:以中国大陆为例(英文)》
WCR of the China mainland was calculated by formula(6)and related data,and it was normalized according to the smaller-better principle.The subjective weight vector of subsystems R-P,R-E and R-D calculated by AHP was w1=[0.600,0.200,0.200]T and the objective weight vector calculated by the entropy method was w2=[0.241,0.250,0.509]T.So the combination weight was W=[0.421,0.225,0.354]T;the Catastrophe membership degree of the general indicator and 3 subsystems was calculated according to catastrophe model,the fold,the cusp and the swallowtail,as shown in Table 3.The WSI for each province from 2001 to 2017 was calculated by formulas(8)and(9).The normalized average of indicators was divided into 5 sections with intervals of0.2.Combining catastrophe model and combination weight,the critical value(1?4)of each interval value was obtained.According to the criteria in Table 2,the development stage and warning state of the water resources system in each province was evaluated comprehensively.
| 图表编号 | XD0035326800 严禁用于非法目的 |
|---|---|
| 绘制时间 | 2019.01.30 |
| 作者 | 臧正 |
| 绘制单位 | 淮阴师范学院城市与环境学院、淮河生态经济带研究院 |
| 更多格式 | 高清、无水印(增值服务) |
查看“Table 4 Comprehensive assessment results of water resources for the China mainland”的人还看了
-

- 表8 某木结构历史建筑结构安全综合评估结果Table 8 Comprehensive assessment result a timber structure historical building’s structural safe-


![Table 1 Assessment criteria for the sustainable use of water resources in Yinchuan City[22-31]](http://bookimg.mtoou.info/tubiao/gif/AAGR201810017_21300.gif)


