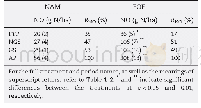
《Table 3–Cumulative nitric oxide (NO) emissions of each treatment during different periods and their
 提示:宽带有限、当前游客访问压缩模式
本系列图表出处文件名:随高清版一同展现
《Characterizing nitric oxide emissions from two typical alpine ecosystems》
The conservative NO fluxes varied between 0 and 5.7μg N/(m2hr)in the NAM and between-0.2 and 28.5μg N/(m2hr)in the FOF,occasionally falling within the negative and positive detection limits(Fig.2a).The gas emissions from the NAM and FOF conservatively accumulated to 56±4 and 208±13 g N/(ha year),respectively(Table 3),with the latter being 2.7 times higher(p<0.01).The conservative emissions during the spring FTP,NGS and GS accumulated to 30±2,27±4 and29±1 g N/(ha year),respectively,in the NAM and to 36±5,106±7 and 103±16 g N/(ha year),in the FOF,respectively(Fig.2b).The emissions in the NAM during any of the periods were clearly significantly lower than those in the FOF(Table3).In addition,the seasonal variation pattern in the NO fluxes also differed between the two ecosystems(Fig.2a).The fluxes in the NAM were more definitive during the spring FTP and GS,relative to those during the other periods.The spring FTP and NGS contributed 35%and 47%of the annual cumulative emission from the NAM,respectively(Table 3).The most intense fluxes in the FOF occurred following the basal fertilization event(Fig.2a).The greater fluxes over the annual mean in the FOF(3.2μg N/ (m2hr)) lasted for 17 d and accounted for up to 29%of the annual emissions.Smaller fluxes occurred following the nitrogen top-dressing or during the spring FTP,compared to those following the basal fertilization.In the FOF,the spring FTP and NGS accounted for17%and 51%of the annual emission,respectively(Table 3).Of the cumulative emissions during the NGS,the spring FTP contributed 77%±5%in the NAM but only 35%±2%in the FOF,which showed a significant difference(p<0.001).
| 图表编号 | XD0033521900 严禁用于非法目的 |
|---|---|
| 绘制时间 | 2019.03.15 |
| 作者 | Fei Lin、Chunyan Liu、Xiaoxia Hu、Yongfeng Fu、Xunhua Zheng、Rui Wang、Wei Zhang、Guangmin Cao |
| 绘制单位 | State Key Laboratory of Atmospheric Boundary Layer Physics and Atmospheric Chemistry (LAPC), Institute of Atmospheric Physics, Chinese Academy of Sciences、College of Earth and Planetary Sciences, University of Chinese Academy of Sciences、State Key Laborat |
| 更多格式 | 高清、无水印(增值服务) |
查看“Table 3–Cumulative nitric oxide (NO) emissions of each treatment during different periods and their contributions (RNO)”的人还看了
-

- 表3 破坏前后各试验结束时甲烷排采数据统计Tab.3 Statistics of methane emission data at the end of each test before and after failure


