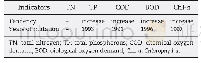
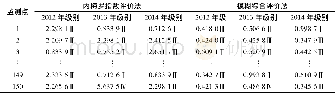
《Table 1–Test results for the mutational years of water quality indicators in Tai lake.》
 提示:宽带有限、当前游客访问压缩模式
本系列图表出处文件名:随高清版一同展现
《Three decades of changes in water environment of a large freshwater Lake and its relationship with socio-economic indicators》
From 1980 to 2012,there are a significant linear relationships between water quality indicators(TN,TP,Ch1-a,COD,and BOD)and time,for which,all the R2values are greater than 0.5(p<0.01),revealing that the concentrations of water quality indicators were increasing(Fig.1).Mean annual concentrations of TN increased significantly with fluctuations from 1980 to2004,followed by intermittent small-magnitude decreases from2004 to 2010 and increased again until 2012.Generally,concentrations of TN increased from 0.65 mg/L in 1980 to2.7 mg/L in 2012,more than quadrupling in 32 years.During the study period,four obvious peaks in concentrations of TN were observed in 1988,1992,1997,and 2004,with the greatest concentration(4.8 mg/L)in 2004.Mean annual increases were0.084 mg/L.However,this varied for different time intervals.From 1980 to 1990,the mean annual rate of increase was0.084 mg/L,rising to 0.13 mg/L during 1990–2000 and reaching the greatest value of 0.448 mg/L in 2004.Following that,concentrations of TN decreased at a rate of 0.26 mg/L until2012.Mean concentrations of TN were 1.6 mg/L,2.8 mg/L,and3.6 mg/L,during the 1980s(1980–1990),1990s(1990–2000)and2000s(2000–2012),respectively.The Mann-Kendall trend analysis revealed that concentrations of TN increased continuously throughout the 32 years considered during this study,without any sharp transitions(Table 1).
| 图表编号 | XD0033518500 严禁用于非法目的 |
|---|---|
| 绘制时间 | 2019.03.15 |
| 作者 | Cuicui Li、Weiying Feng、Fanhao Song、Zhongqi He、Fengchang Wu、Yuanrong Zhu、John P.Giesy、Yingchen Bai |
| 绘制单位 | Guangzhou Institute of Geochemistry, Chinese Academy of Sciences、University of Chinese Academy of Sciences、State Key Laboratory of Environmental Criteria and Risk Assessment, Chinese Research Academy of Environmental Sciences、State Key Laboratory of Envir |
| 更多格式 | 高清、无水印(增值服务) |