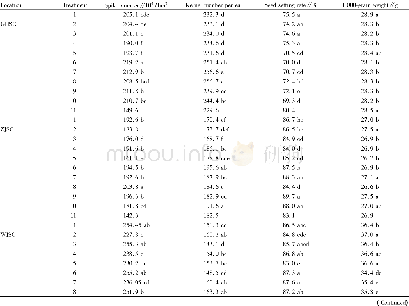
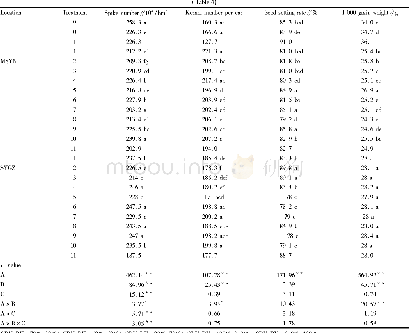
《Table 3–Wheat yield and yield components with different N split applications.》
 提示:宽带有限、当前游客访问压缩模式
本系列图表出处文件名:随高清版一同展现
《Timing and splitting of nitrogen fertilizer supply to increase crop yield and efficiency of nitrogen utilization in a wheat–peanut relay intercropping system in China》
In both growing seasons,N treatment significantly(P<0.001)affected the grain yield of wheat(Table 3).Grain yields with all N fertilizer treatments were significantly increased by 36.9%–47.8%and 36.0%–41.8%,respectively,compared with those in N0.However,in comparison with N1,grain yields of N2 and N3 did not decrease despite a 30%reduction in fertilizer use.The highest yield,which averaged8283.8 kg ha-1,was observed in N3 in both years.There was no significant difference between the grain yields in N2 and N3.Yield components also differed among treatments.The effects of N treatment and year on 1000-kernel weight were significant(P<0.001).Spike number,kernel number per spike,and 1000-kernel weight in all N fertilizer treatments were higher than those in N0,especially kernel number per spike and 1000-kernel weight.In 2016,kernel number per spike and 1000-kernel weight were increased by 4.5%and3.7%,respectively,in N2,and by 11.2%and 2.3%,respectively,in N3,compared to those in N1.In 2017,the 1000-kernel weights in N2 and N3 increased by 3.2%and 3.7%,respectively,compared to those in N1.In addition,the interaction of N treatment×year had a significant effect on the grain yield(P<0.001).
| 图表编号 | XD0029302400 严禁用于非法目的 |
|---|---|
| 绘制时间 | 2019.02.01 |
| 作者 | Zhaoxin Liu、Fang Gao、Yan Liu、Jianqun Yang、Xiaoyu Zhen、Xinxin Li、Ying Li、Jihao Zhao、Jinrong Li、Bichang Qian、Dongqing Yang、Xiangdong Li |
| 绘制单位 | State Key Laboratory of Crop Biology, Shandong Agricultural University、College of Agronomy, Shandong Agricultural University、State Key Laboratory of Crop Biology, Shandong Agricultural University、College of Agronomy, Shandong Agricultural University、State |
| 更多格式 | 高清、无水印(增值服务) |
查看“Table 3–Wheat yield and yield components with different N split applications.”的人还看了
-

- Table 4 Yield components of different test sites, different nitrogen amounts and different ratios of slow-controlled rel
-

- Table 4 Yield components of different test sites, different nitrogen amounts and different ratios of slow-controlled rel


