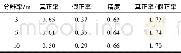
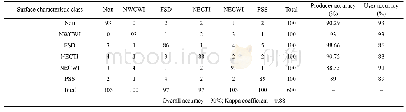
《表5 混淆矩阵法的模型计算结果评价Table 5 Evaluation of the confusion matrix for the calculative result》
 提示:宽带有限、当前游客访问压缩模式
混淆矩阵的评价结果如表5所示,3、5和10 m分辨率数字高程模型数据的精度和“真正率/假正率≥1”均满足预测要求,且3 m分辨率的数据具有最高的真正率.因此,混淆矩阵法的验证结果表明Scoops3D模型的预测结果和分类方法具有可靠性.
| 图表编号 | XD002814300 严禁用于非法目的 |
|---|---|
| 绘制时间 | 2018.04.01 |
| 作者 | 辛星、张帆宇 |
| 绘制单位 | 兰州大学西部灾害与环境力学教育部重点实验室、兰州大学土木工程与力学学院、兰州大学西部灾害与环境力学教育部重点实验室、兰州大学土木工程与力学学院 |
| 更多格式 | 高清、无水印(增值服务) |
