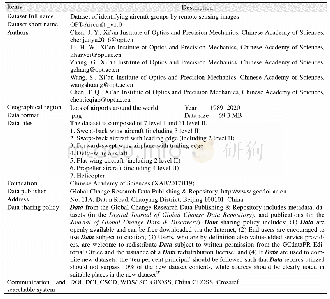
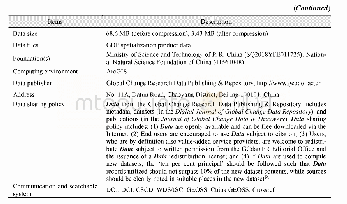
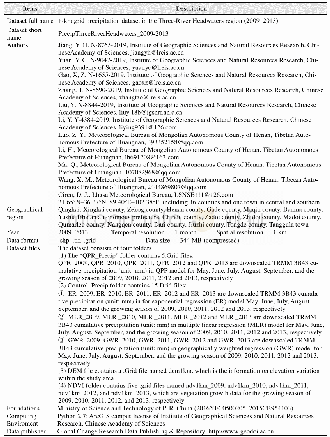
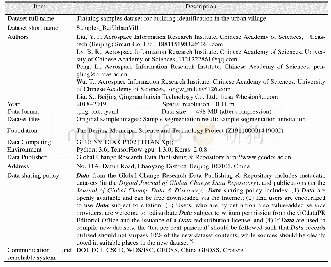
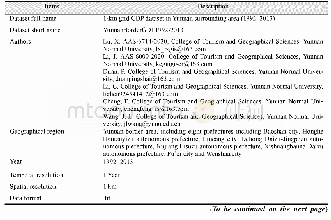
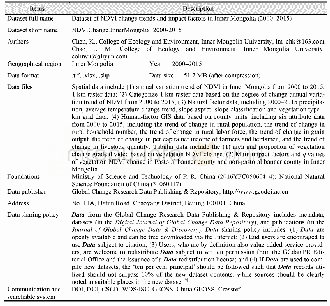
《Table 1 Metadata summary for the dataset of lake level changes in the globe using multi-altimeter d
 提示:宽带有限、当前游客访问压缩模式
本系列图表出处文件名:随高清版一同展现
《多源雷达高度计全球典型湖泊水位变化数据集(2002-2016)》
These data were then pre-processed.Firstly,the thresholds of different temporal images over lakes were selected using the NDVI channel of MODIS MOD13Q1 products,and then the processing,including coordinate projection conversion,batch cutting,density segmentation,and the conversion from raster to vector,was conducted using the ENVI software.The boundary of each lake was delineated for the period from 2002 to 2016.Secondly,a visual interpretation was made to remove the outliers in all 20 Hz elevation measurements,and then the difference among the average water levels was determined.Then,a visual interpretation was conducted to remove the outliers again.The daily water level was obtained by removing outliers using the 3σcriterion and averaging all the valid water levels for each daily data.The Gaussian filtering method was used to remove noise from the overall daily water levels,and a time series of lake levels was obtained.The monthly average water level was obtained based on daily water levels,and the annual average water level was obtained based on monthly water levels.
| 图表编号 | XD0027638600 严禁用于非法目的 |
|---|---|
| 绘制时间 | 2018.09.25 |
| 作者 | 廖静娟、沈国状、赵云 |
| 绘制单位 | 中国科学院遥感与数字地球研究所数字地球重点实验室、海南省地球观测重点实验室、中国科学院遥感与数字地球研究所数字地球重点实验室、中国科学院遥感与数字地球研究所数字地球重点实验室、中国科学院大学 |
| 更多格式 | 高清、无水印(增值服务) |
