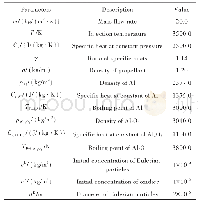
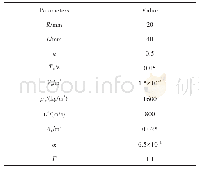
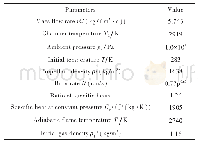
《Table 1.Simulation Parameters》
 提示:宽带有限、当前游客访问压缩模式
本系列图表出处文件名:随高清版一同展现
《SER estimation method for 56 GBaud PAM-4 transmission system》
The simulation setup is shown in Fig.1.The pseudorandom bit sequence(PRBS)of length 216-1 is used to generate the PAM-4 data signal.A single drive Mach–Zehnder modulator(MZM)is used to modulate the continuous wave(CW)laser source with a central wavelength of 1310 nm with PAM-4 data.The modulated data is transmitted over a standard single mode fiber(SSMF)of a length of 10 km.A variable optical attenuator(VOA)is used before the receiver to adjust received optical powers(ROPs).The transmitted optical signal is then detected by a photo diode(PD).The signal at the output of PD passes through a tunable fourth-order Bessel lowpass filter(LPF)which can operate at different bandwidths.It is used to analyze the bandwidth limitations of the transmission system.Finally,the received data is sent to offline DSP.The received signal was first normalized and then resampled to two samples per symbol to perform the retiming operation.A 5 tap T/2 adaptive equalizer via the least mean square(LMS)algorithm is used for the channel equalization.Finally,the symbol error by the counting method was calculated after the hard decision.Table 1 shows the simulation parameters used in our system.A detailed simulation study is carried out to evaluate the accuracy of our SER estimation method in different scenarios,especially for different receiver bandwidths.For this purpose,the contour plots are drawn,as shown in Fig.2,for the receiver bandwidth of30 GHz using Eq.(3).The range of values of P1and P2between 0 and 2.5 with an increment of 0.25 is used to obtain the optimum contour line,where matching(i.e.Z?SERC-SERGGD?0)between SERCand SERGGDis achieved.The desired contour line providing Z?0 can be seen from Figs.2(a)–2(e)for ROPs of-4.41,-5.06,-5.71,-6.36,and-7.01 d Bm.However,Z is not converging to zero,as shown in Fig.2(f),for-7.66 d Bm,and same is true for even lower ROPs.The reason for this can be understood by observing the SER,which tends to go higher with decreasing ROPs.The PDF of the received signal at a higher SER loses its shape and does not provide n adequate P values,which ultimately cannot give a SERGGDequal to SERCat lower ROPs.The contour lines at Z?0 are combined in one figure for corresponding ROPs at 30 GHz,as shown in Fig.2(g).The dashed arrow line is drawn diagonally,which is intersecting the contour lines and provides a single optimum value of P.
| 图表编号 | XD0022539500 严禁用于非法目的 |
|---|---|
| 绘制时间 | 2018.04.10 |
| 作者 | Aadil Raza、Kangping Zhong、Salman Ghafoor、Saeed Iqbal、Muhammad Adeel、Shahid Habib、Muhammad Fasih Uddin Butt、Chao Lu |
| 绘制单位 | COMSATS Institute of Information Technology (CIIT)、Department of Electronic and Information Engineering, The Hong Kong Polytechnic University、National University of Sciences and Technology (NUST)、COMSATS Institute of Information Technology (CIIT)、Departme |
| 更多格式 | 高清、无水印(增值服务) |


