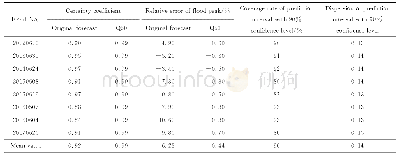
《Tab.1 Forecast evaluation results based on quantile regression model(calibration period)》
Fig.2shows the results of the No.20120610observed flood series,the original model forecast series,and the prediction preferred value(Q50)series provided by the quantile regression model.It can be seen from the figure that compared with the forecasting results of the original model,the prediction preferred value results provided by the quantile regression model are closer to the actual observed series.This shows that the quantile regression model cannot only quantify the uncertainty of forecasting,but also correct the model forecast,so as to provide more accurate deterministic forecasting results.
| 图表编号 | XD00224304400 严禁用于非法目的 |
|---|---|
| 绘制时间 | 2020.10.25 |
| 作者 | 胡义明、罗序义、梁忠民、黄一昕、蒋晓蕾 |
| 绘制单位 | 河海大学水文水资源学院、河海大学水文水资源学院、河海大学水文水资源学院、河海大学水文水资源学院、河海大学水文水资源学院 |
| 更多格式 | 高清、无水印(增值服务) |
 提示:宽带有限、当前游客访问压缩模式


