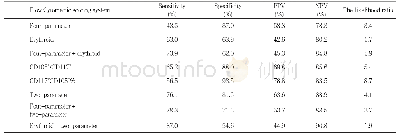
《Tab.2 Monthly precipitation score table of different GCMs》
Fig.2is the box chart which is drawn with the measured data and the output data of the GCMs calculated after the downscaling,based on the climate evaluation index[33]of the Canadian Meteorological Research Center,so as to evaluate the simulation performance of the downscaling model in the study watershed.In the figure,PrcpTot represents the total annual precipitation;R10represents the total number of days with annual daily precipitation≥10mm;SDII represents the ratio of total precipitation to the number of days;R95pTot represents the total amount of precipitation of>95th percentile of daily precipitation.It can be seen from Fig.2(a)that,as far as PrcpTot index is concerned,the mean error of precipitation in each climate model compared with the measured value is within 5%after downscaling,and Miroc5is the closest to the measured value.The inter-annual distribution of annual precipitation of each climate model varies,and the integrated model is obtained by the weighted aggregation of each model.The inter-annual difference is small and close to the mean value.Fig.2(b)shows the total number of days with annual daily precipitation≥10 mm in each climate model,and thus it can be found that the average value of each climate model is 13days,lower than the measured value of 15days.It can be seen from the side that SDSM is not very ideal for extreme precipitation simulation after downscaling.In Fig.2(c),it shows the ratio of total precipitation and number of days in each climate model,in which the GFDL-ESM2M is closer to the measured value.Fig.2(d)shows the sum of the precipitation of>95th percentile of daily precipitation for each climate model,in which MIROC-ESM-CHEM is the closest to the measured value.In conclusion,none of the climate models is better than other climate models,while the average value of all indexes of the integrated climate model is close to the measured value,signaling satisfying performance.Therefore,the adoption of the integrated climate model can effectively reduce the simulation error.
| 图表编号 | XD00204131900 严禁用于非法目的 |
|---|---|
| 绘制时间 | 2020.12.25 |
| 作者 | 娄伟、李致家、刘玉环 |
| 绘制单位 | 河海大学水文水资源学院、河海大学水文水资源学院、河海大学水文水资源学院 |
| 更多格式 | 高清、无水印(增值服务) |
查看“Tab.2 Monthly precipitation score table of different GCMs”的人还看了
-

- 表2 观测站点气温和降水的回归拟合方程Table 2 Regression fitting equations of temperature and precipitation in different observation sites
 提示:宽带有限、当前游客访问压缩模式


