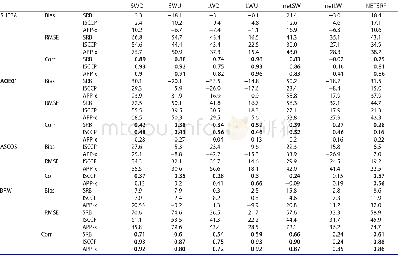
《Table 1.comparisons between the satellite-derived and in situ-measured netsr F, as well as each flu
 提示:宽带有限、当前游客访问压缩模式
本系列图表出处文件名:随高清版一同展现
《Assessing satellite-derived net surface radiative flux in the Arctic》
notes:the bias,rmse and correlation between the satellite products and in situ observations are calculated for the time periods that the in situ observations are available(see Figure 3 for further detail).the locations for the comparisons are shown in F
Statistical comparisons between the satellite-derived and in situ measured NETSRF,as well as each flux component,are presented in Table 1,including the bias,rootmean-square error(RMSE),and correlation.The bias,RMSE,and correlation between the satellite products and in situ observations are calculated for the periods that the in situ observations are available.Specifically,SHEBA is from 31October 1997 to 28 September 1998;AOE01 is from 3–19August 2001;ASCOS is from 15 August to 1 September2008;BRW is from 26 April 1993 to 31 December 2007.The statistics are calculated based on the 3-h data of SRB and ISCCP,but the twice-daily data of APP-x.The locations of the comparisons are shown in Figure 1.We extracted the corresponding time series that have the smallest distance relative to the in situ observations.
| 图表编号 | XD00187336800 严禁用于非法目的 |
|---|---|
| 绘制时间 | 2018.03.16 |
| 作者 | SONG Mi-Rong、LIU Ji-Ping |
| 绘制单位 | State Key Laboratory of Numerical Modeling for Atmospheric Sciences and Geophysical Fluid Dynamics, Institute of Atmospheric Physics, Chinese Academy of Sciences、State Key Laboratory of Numerical Modeling for Atmospheric Sciences and Geophysical Fluid Dyn |
| 更多格式 | 高清、无水印(增值服务) |
查看“Table 1.comparisons between the satellite-derived and in situ-measured netsr F, as well as each flux component, includin”的人还看了
-
- Table 3 Alleles discrepancy of the selected 30 variants between cases and controls in the second stage of time of flight
-
- Table 1 Metadata profile of the“In situ dataset of monthly litterfall in the forests of Pinus thunbergii Parl.,Quercus v
-
- Table 1 Metadata profile of the“In situ dataset of monthly litterfall in the forests of Pinus thunbergii Parl.,Quercus v


