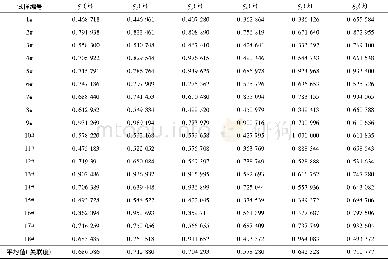
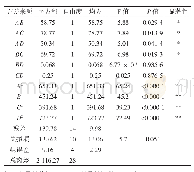
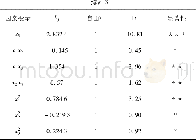
《Table 3 Regression coefficient results of poverty degree》
 提示:宽带有限、当前游客访问压缩模式
本系列图表出处文件名:随高清版一同展现
《Influence Mechanism for Assessment of Implementation Effect of Policy of Relocating the Poor》
Note:The numbers in parentheses are robust standard errors,and***,**,and*denote statistical significance at 1%,5%,and 10%,respectively.
Taking respondents from counties of different poverty degrees as objects,we studied the influence of the poverty degree on implementation effect assessment of the policy of relocating the poor.According to the poverty degree differences,we divided respondents into respondents from extremely poor counties,very poor counties,and general poor counties,and we took the general poor counties as the reference group.In this study,we adopted ordinary ordinal Probit model and order Probit model to conduct the item test.Table 3 listed the threshold model regression results.According to the analysis of regression coefficient results,the two models were consistent in the direction of influence,but the overall estimate of the order Probit model was slightly higher than the Probit regression estimate.Regression data showed that samples from both extremely and very poor counties passed the significance test at 5%level and their coefficients were positive.This indicates that under the premise of other conditions not changed,compared with the group of\""general poor counties\"",respondents from severer poor counties had higher satisfaction with the policy of relocating the poor.
| 图表编号 | XD00182612100 严禁用于非法目的 |
|---|---|
| 绘制时间 | 2018.09.01 |
| 作者 | Shengyin XIONG |
| 绘制单位 | China Western Economic Research Center,Southwestern University of Finance and Economics、Business Department,Luzhou Vocational and Technical College |
| 更多格式 | 高清、无水印(增值服务) |


