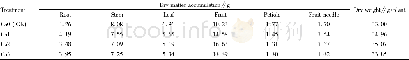
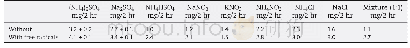
《Table 2 The impact on dry matter accumulation of peanut by Ca application》
 提示:宽带有限、当前游客访问压缩模式
本系列图表出处文件名:随高清版一同展现
《Effects of Calcium Application Rate on Dry Matter Accumulation and Yield of Peanut》
Seen from Table 2,dry matter accumulation of root,stem,leaf,petiole and fruit needle from peanut in each treatment showed a decreasing trend with Ca application amount increased,the minima were in the treatment Ca2,and they showed rising trends when increased Ca amount again.Dry matter accumulation of fruit in each treatment showed a rising trend,which was the maximum in the treatment Ca2,and it showed a declining trend when increased Ca amount again.Dry weight of single plant showed a rising trend with Ca application amount increased,which was the maximum in treatment Ca2,and it showed a declining trend when increased Ca amount again.It illustrated that dry matter accumulation of peanut did not increase with Ca application amount increased when Ca application amount increased to certain level.
| 图表编号 | XD00182589000 严禁用于非法目的 |
|---|---|
| 绘制时间 | 2018.05.01 |
| 作者 | Junjie XIU、Xueliang LIU |
| 绘制单位 | Tieling Academy of Agricultural Sciences、Tieling Academy of Agricultural Sciences |
| 更多格式 | 高清、无水印(增值服务) |

