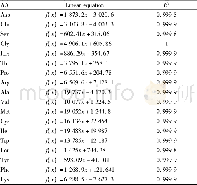
《Table 1 Standard curves and correlation coefficients》
 提示:宽带有限、当前游客访问压缩模式
本系列图表出处文件名:随高清版一同展现
《Accumulation Characteristics and Safety Evaluation of Heavy Metals in Four Kinds of Aquatic Products from Lake Taihu》
2.3.3 Sample determination.Atomic absorption spectrophotometer was used to detect standard solution and sample solution.The correlation of the drawn standard curve was more than 99.1%,and linear equation and correlation coefficient were shown as Table 1.Cd,Cu and Zn were detected by flame atomic absorption spectrophotometer,while Pb was detected by graphite furnace atomic absorption spectrophotometer,and they were all repeated for three times.
| 图表编号 | XD00182582100 严禁用于非法目的 |
|---|---|
| 绘制时间 | 2018.05.01 |
| 作者 | Xiaowen ZHANG、Liuyi SHAO、Bin LIAN |
| 绘制单位 | College of Life Science,Nanjing Normal University、College of Life Science,Nanjing Normal University、College of Life Science,Nanjing Normal University |
| 更多格式 | 高清、无水印(增值服务) |


