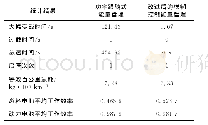
《Tab.4 The improved ratio of PSO-SA》
 提示:宽带有限、当前游客访问压缩模式
本系列图表出处文件名:随高清版一同展现
《Ad-hoc移动朵云中基于粒子群优化和模拟退火优化的任务分配算法(英文)》
As can be seen from Fig.6 and Fig.7,w hen the number of slave nodes is small,the performance of the three algorithms is almost the same.But,w ith the increase in the number of slave nodes,the performance of the PSO-SA is better than that of the other tw o heuristic algorithms.When the number of slave nodes continues to increase,the results of the three algorithms tend to be stable.This is because in the case of the small number of salve nodes,the probability of the new candidate solution result being better than that of previous optimal solution is great.How ever,as the slave node continues to increase,this probability w ill drop,w hich leads to the gradual stabilization of the value.In order to compare the performances of the PSO-SA w ith other heuristics algorithms more clearly,Tab.4 show s the improved ratio of the PSO-SA in terms of average energy consumption and time delay.In Tab.4,the average energy consumption of BP-SO,GA,PSO-SA algorithms is the average energy consumption of all devices in AM C w hen the number of slave nodes changes from 1 to 10,and the average time delay is the average energy time delay produced by different algorithms w hen the number of slave nodes changes from 1 to10.Energy consumption improved by PSO-SA represents the ratio of the reduced average energy consumption of PSO-SA to that of BPSO or GA(R1).The time delay improved by PSO-SA represents the ratio of the reduced average time delay of PSO-SA to that of BPSO or GA(R2).It can be seen from Tab.4 that compared to the BPSO and GA,the performance of the PSO-SA has been greatly improved in terms of energy consumption and time delay.
| 图表编号 | XD0015630800 严禁用于非法目的 |
|---|---|
| 绘制时间 | 2018.12.01 |
| 作者 | 黄博南、夏玮玮、章跃跃、张静、邹倩、燕锋、沈连丰 |
| 绘制单位 | 东南大学移动通信国家重点实验室、东南大学移动通信国家重点实验室、东南大学移动通信国家重点实验室、东南大学移动通信国家重点实验室、东南大学移动通信国家重点实验室、东南大学移动通信国家重点实验室、东南大学移动通信国家重点实验室 |
| 更多格式 | 高清、无水印(增值服务) |

![表4 改善前后备用药品管理细节改善情况[例 (%) ]Tab 4 Drug management details before and after the improvement[n (%) ]](http://bookimg.mtoou.info/tubiao/gif/ZNYX201902080_12100.gif)


