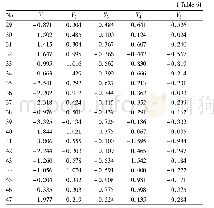
《Table 6 Annual per-capita consumption of rice》
 提示:宽带有限、当前游客访问压缩模式
本系列图表出处文件名:随高清版一同展现
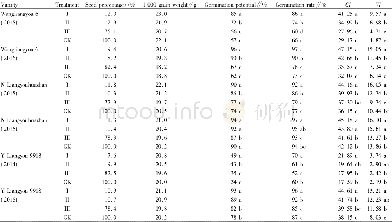
《Agricultural Exports Competitiveness of Pakistan in Global Market》
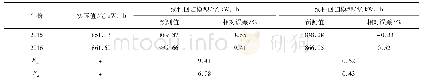
Thailand had an increasing consumption pattern for the selected sample years of study.Tables 7 and 8also confirmed that Thailand had decreased its competitiveness over the years except 2004 and 2008.The USA had a mixed consumption pattern,and it was neither increased nor decreased greatly during these 11years.Competitiveness also showed the same results,but in general competitiveness decreased and RCA#was not competitive,because it was less than one for all the years.Vietnam and Thailand increased their consumption greatly during all the years except 2005to 2007.Competitiveness was massively decreased in case of Vietnam especially for 2012 and 2013.Cambodia appeared as a massive rice consuming country,its consumption pattern indicated that consumption rose over the study period.Competitiveness indicators RCA and RCA#showed that Cambodia was not competitive at all from 2003 to 2009 as RCA#was negative during these years.
| 图表编号 | XD0014154200 严禁用于非法目的 |
|---|---|
| 绘制时间 | 2018.06.25 |
| 作者 | Majid Lateef、Tong Guang-ji、Muhammad Usman Riaz、Mazhir Nadeem Ishaq、Muhammad Abdullah、Zeeshan Ahmad |
| 绘制单位 | College of Economics and Management, Northeast Forestry University、College of Economics and Management, Northeast Forestry University、School of Management, Harbin University of Science and Technology、College of Economics and Management, Northeast Agricult |
| 更多格式 | 高清、无水印(增值服务) |
