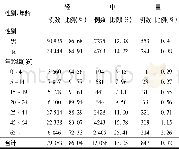
《Table 1–ANOVA of disease severity in the BC1F2:3population.》
 提示:宽带有限、当前游客访问压缩模式
本系列图表出处文件名:随高清版一同展现
《Identification of stably expressed QTL for resistance to black shank disease in tobacco(Nicotiana tabacum L.) line Beinhart 1000-1》
df,degrees of freedom.
The BS responses of the parents were significantly different;BH expressed a very high level of resistance with a score of 0for both disease severity(DS)and disease index(DI),whereas XHJ was highly susceptible with of DS 9 and DI of 84.50%–100.00%for different environments(Fig.2).The average value of DS for the F2population was 3.20,and for the BC1F2,3.57.For the BC1F2:3population,the mean DI for the field stage and seedling stage tests were 42.02%and 41.86%,respectively.All populations displayed significantly skewed distributions in the direction of resistance,indicating that both major genes and polygenes controlled resistance to BS.As shown in Table 1,the ANOVA detected highly significant differences among lines(P<0.001)and no significant differences between environments and lines(P=0.289).
| 图表编号 | XD0012322600 严禁用于非法目的 |
|---|---|
| 绘制时间 | 2018.06.01 |
| 作者 | Yusheng Zhang、Xuan Guo、Xingxing Yan、Min Ren、Caihong Jiang、Yazeng Cheng、Liuying Wen、Dan Liu、Yu Zhang、Mingming Sun、Quanfu Feng、Aiguo Yang、Lirui Cheng |
| 绘制单位 | Key Laboratory of Tobacco Improvement and Biotechnology,Tobacco Research Institute,Chinese Academy of Agricultural Sciences、Key Laboratory of Tobacco Improvement and Biotechnology,Tobacco Research Institute,Chinese Academy of Agricultural Sciences、College |
| 更多格式 | 高清、无水印(增值服务) |
查看“Table 1–ANOVA of disease severity in the BC1F2:3population.”的人还看了
-

- 表2 2013~2015年7大行政区重症HFMD的病原构成Table 2 The pathogen composition of severe HFMD in seven administrative regions between 201
-

- Table 4 Diagnostic accuracy of 80%Crohn’s Disease Endoscopic Index of Severity reduction at week 14 for the diagnosis of


