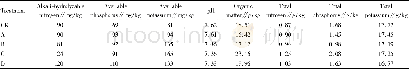
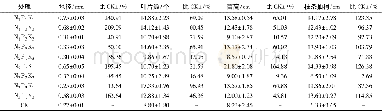
《表3 A区生产前后土壤肥力因子水平Table 3 The level of soil fertility before and after planting in sampling area A》下
 提示:宽带有限、当前游客访问压缩模式
注:表中同列上标不同字母表示差异显著(P<0.05),下同。Note:Different superscript letters in the same column mean significant difference(P<0.05),the same below.
2016年水稻生产后,两种模式田土壤肥力水平对比显示,A区稻虾共作模式田的土壤肥力水平普遍高于单作稻田(表3)。其中:有机质高12.8%;全磷和有效磷分别高出75.0%和1.7%;全钾和速效钾分别高出11.4%和11.1%;全氮和碱解氮分别高出12.2%和19.7%;p H和阳离子交换量在两种模式田中差异不显著(P>0.05)。
| 图表编号 | XD00826700 严禁用于非法目的 |
|---|---|
| 绘制时间 | 2018.01.30 |
| 作者 | 吴本丽、陈贵生、赵慧敏、王晓健、黄龙、陈静、何吉祥 |
| 绘制单位 | 安徽省农业科学院水产研究所、安徽省巢湖市柘皋镇农业综合服务站、巢湖市水产局、安徽省合肥市长丰县杜集乡农业综合服务站、安徽省农业科学院水产研究所、安徽省农业科学院水产研究所、安徽省农业科学院水产研究所 |
| 更多格式 | 高清、无水印(增值服务) |
