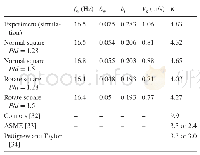
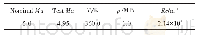
《Table 2 Comparison of fl uidelastic coeffi cients》
 提示:宽带有限、当前游客访问压缩模式
本系列图表出处文件名:随高清版一同展现
《Investigation of the Vibration Behavior of Fluidelastic Instability in Closely Packed Square Tube Arrays》
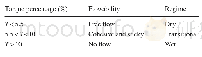
A 3D tube model,shown in Fig.11,can be established based on the experimental parameters(Table 1)and assumptions above.A cubic fl uid fi eld with a uniform fl ow inlet and pressure outlet is adopted to simulate the test section in a water channel.A total of 25 tubes are arranged 5×5 to achieve a normal square in the fl uid domain.Moving mesh boundariesand rigid body movements are established to ensure that the tubes can vibrate under the fl uid forces.All tubes feature their own local coordinates and are free to oscillate in the streamwise and transverse directions.
| 图表编号 | XD0076871700 严禁用于非法目的 |
|---|---|
| 绘制时间 | 2019.04.01 |
| 作者 | Wei Tan、Hao Wu、Guorui Zhu |
| 绘制单位 | School of Chemical Engineering and Technology,Tianjin University、National Key Laboratory of Hydraulic Engineering Simulation and Safety,Tianjin University、School of Chemical Engineering and Technology,Tianjin University、School of Chemical Engineering and |
| 更多格式 | 高清、无水印(增值服务) |
