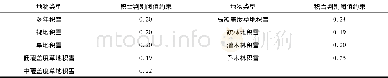
《Table 1 Discrimination precisions of different materials obtained using the SVMclassifiers》
 提示:宽带有限、当前游客访问压缩模式
本系列图表出处文件名:随高清版一同展现
《Experimental validation of material discrimination ability of muon scattering tomography at the TUMUTY facility》
In this study,only half of the datasets were used to train the SVM classifiers and the other half were used as test datasets to evaluate the performance of the classification.Due to the inconsistency of features with different measuring times,different models were trained for 1-,5-,and10-min sub-datasets,as shown in Fig.8.The region in Fig.8 was subdivided into four regions with different colors,representing the results of the SVM classification.The data points were actual results derived from subdatasets of the three experiments.The performance of the classifiers was evaluated with test datasets;the detailed precisions of different materials are listed in Table 1.The overall precisions of the four materials for 1-,5-,and10-min measurements are 70,95,and 99%,respectively.It could be concluded that the longer is the measuring time,the more precise is the classification.Even when the measuring time is only 1 min,the precisions for most materials are higher than 70%,which is acceptable for short time measurements.With this method,material discrimination with muon scattering within short measuring times was achieved.
| 图表编号 | XD0065045300 严禁用于非法目的 |
|---|---|
| 绘制时间 | 2019.08.01 |
| 作者 | Xing-Yu Pan、Yi-Fan Zheng、Zhi Zeng、Xue-Wu Wang、Jian-Ping Cheng |
| 绘制单位 | Key Laboratory of Particle and Radiation Imaging (Ministry of Education) and Department of Engineering Physics,Tsinghua University、Department of Nuclear Engineering, University of California,Berkeley、Department of Radiology and Biomedical Imaging,Universi |
| 更多格式 | 高清、无水印(增值服务) |


