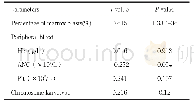
《Table 3 Linearity between parameters》
 提示:宽带有限、当前游客访问压缩模式
本系列图表出处文件名:随高清版一同展现
《GIS-based landslide susceptibility mapping using numerical risk factor bivariate model and its ensemble with linear multivariate regression and boosted regression tree algorithms》
A linear test should be performed between the parameters in LSM,as a linear correlation between the parameters will decrease the prediction accuracy of the model(Chen et al.2017b).In this study,two parameters(tolerance and variance inflation factor[VIF])were used for the linear test.If the coefficient of tolerance is≤1 and the value of the VIF factor is≥10,then the existence of linearity between the parameters is confirmed(Chen et al.2017b,c).The results of the linearity test between the parameters(Table 3)showed that,among the 20 parameters,five were co-linear,namely drainage density,profile curvature,total curvature,soil texture and stream power index.Therefore,these parameters were excluded due to their potential to decrease model accuracy,and the modelling was conducted using the remaining 15parameters.
| 图表编号 | XD0056564400 严禁用于非法目的 |
|---|---|
| 绘制时间 | 2019.03.01 |
| 作者 | Alireza ARABAMERI、Biswajeet PRADHAN、Khalil REZAE、Masoud SOHRABI、Zahra KALANTARI |
| 绘制单位 | Department of Geomorphology,Tarbiat Modares University、Centre for Advanced Modelling and Geospatial Information Systems (CAMGIS),Faculty of Engineering and IT,University of Technology Sydney、Department of Energy and Mineral Resources Engineering,Choongmu- |
| 更多格式 | 高清、无水印(增值服务) |


