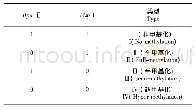
《Table 4.FTIR band chemistry》
 提示:宽带有限、当前游客访问压缩模式
本系列图表出处文件名:随高清版一同展现
《"Structural, compositional and mineralogical characterization of carbonatitic copper sulfide: Run of mine, concentrate and tailings"》
Fig.4 and Table 4 summarize the results of the FTIR spectroscopic analysis of the three samples.Fig.4 displays vibration patterns related to functional groups and mineral matter,as identified and recorded during the analysis.Table4 elaborates the chemical nature of the various observed band peaks.As previously indicated in the analysis of the XRD results,the ROM and tails diffraction patterns were relatively similar in shape,suggesting identical chemistry-related functional groups.However,the concentrate sample displayed a stretched-out diffraction pattern with broader peaks.In addition,compared to the peak positions in the diffraction patterns of the two other sample streams(ROM and tails),all of the peaks in the pattern of the concentrate sample shifted from their original positions.
| 图表编号 | XD0050011100 严禁用于非法目的 |
|---|---|
| 绘制时间 | 2019.02.01 |
| 作者 | Kolela J Nyembwe、Elvis Fosso-Kankeu、Frans Waanders、Kasongo D Nyembwe |
| 绘制单位 | Water Pollution Monitoring and Remediation Initiatives Research Group, School of Chemical and Minerals Engineering, Faculty of Engineering, North-West University、Water Pollution Monitoring and Remediation Initiatives Research Group, School of Chemical and |
| 更多格式 | 高清、无水印(增值服务) |


