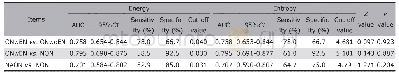
《Table 3.ROC analysis of histogram texture features of the optic nerve in the patients with optic ne
 提示:宽带有限、当前游客访问压缩模式
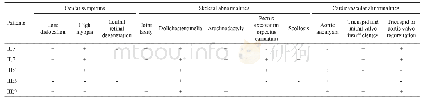
ROC analysis indicated that texture Energy and Entropy both had a relative higher AUC for ONwEN vs.ONwoEN,ONwEN vs.NON and NAON vs.NON(>0.70)(Table 3,Figure 2) .The texture Energy and Entropy had the highest diagnostic specificity(both92.5%)in ONwEN vs.NON(cut-off value=0.030 and5.101,respectively)(Z=0.143,P=0.887) ,and the texture Energy and Entropy had the highest diagnostic sensitivity(both 78.0%)in ONwEN vs.ONwoEN(cutoff value=0.040 and 4.681,respectively;Z=0.097,P=0.923).
| 图表编号 | XD0049500600 严禁用于非法目的 |
|---|---|
| 绘制时间 | 2019.03.01 |
| 作者 | 刘洪娟、周欢粉、宗林雄、刘梦琦、魏世辉、陈志晔 |
| 绘制单位 | 解放军总医院眼科、解放军总医院眼科、解放军总医院海南医院放射科、解放军总医院海南医院放射科、解放军总医院放射科、解放军总医院眼科、解放军总医院海南医院放射科、解放军总医院放射科 |
| 更多格式 | 高清、无水印(增值服务) |