《Table 2 Model results of EPA (emission per area) using OLS (ordinary largest square method) , FEM (
 提示:宽带有限、当前游客访问压缩模式
本系列图表出处文件名:随高清版一同展现
《Life-cycle CO_2 Emissions and Their Driving Factors in Construction Sector in China》
Notes:P<0.10,^;P<0.05,*;P<0.01,**;P<0.001,***.
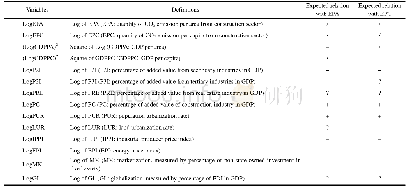
Based on the above hypotheses,several models were developed to examine the effects of each factor and check for spatial autocorrelation.The variables used in these models are defined in Table 1,along with their expected relations to EPA and EPC.
| 图表编号 | XD0046963000 严禁用于非法目的 |
|---|---|
| 绘制时间 | 2019.04.01 |
| 作者 | CUI Can、WANG Zhen、BIN Guoshu |
| 绘制单位 | School of Resource and Environmental Sciences, Wuhan University、School of Resource and Environmental Sciences, Wuhan University、College of Civil Engineering and Architecture, Guilin University of Technology |
| 更多格式 | 高清、无水印(增值服务) |
查看“Table 2 Model results of EPA (emission per area) using OLS (ordinary largest square method) , FEM (fixed effect model) a”的人还看了
-

- Table 1 TESVs per unit area ($/ha per year based on the 2016 value of the USD) (after Costanza et al., 1997)
-

- Table 1 Influential factor definitions and their expected relations with EPA (emission per area) and EPC (emission per c


