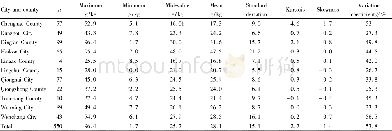
《Table 1 The basic statistics of the soil organic matter and its auxiliary variables》
 提示:宽带有限、当前游客访问压缩模式
本系列图表出处文件名:随高清版一同展现
《Combining Environmental Factors and Lab VNIR Spectral Data to Predict SOM by Geospatial Techniques》
Notes:SOM:soil organic matter,ILUT:the index of land use type,LSWI:land surface water index,EVI:enhanced vegetation index,NDC:the nearest distance to construction land,RDLS:roughness and relief amplitude,CV:coefficient of variance
The distribution of SOM along with some of the predictors was described using classical descriptive statistics(Table 1).SOM values ranged from 17.34 to 50.50 g/kg,and the mean value was 30.12 g/kg and the median value was 28.96 g/kg.The standard variance was 6.69g/kg and the coefficient of variation(CV)was 22.21%,suggesting that SOM had a moderate spatial variation based on Wilding(1985).Six variables were selected as the predictors to construct the SOM prediction models.Table 1 shows the basic statistics of the other predictors.The mean values of elevation,ILUT,LSWI,EVI,RDLS and NDC were 27.47 m,3.06,0.08,0.12,9.28 and2390.67 m,respectively.The CVs of these auxiliary variables indicated that all of these predictors had a different degree of spatial variation across the study region.NDC had the greatest variation(75.71%)and ILUT had the least variation(13.35%).More detailed basic statistics of SOM and its environmental factors can be found in Table 1.
| 图表编号 | XD0046961700 严禁用于非法目的 |
|---|---|
| 绘制时间 | 2019.04.01 |
| 作者 | GUO Long、ZHANG Haitao、CHEN Yiyun、QIAN Jing |
| 绘制单位 | College of Resources and Environment, Huazhong Agricultural University、College of Resources and Environment, Huazhong Agricultural University、School of Resource and Environment, Wuhan University、School of Resource and Environment, Wuhan University |
| 更多格式 | 高清、无水印(增值服务) |
查看“Table 1 The basic statistics of the soil organic matter and its auxiliary variables”的人还看了
-

- 表5 各生育期不同处理及层次土壤有机质和全氮含量Table 5 The soil organic matter and total nitrogen contents in different growth periods and soil


