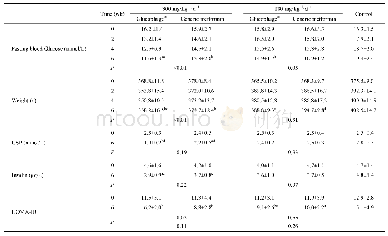
《Table 1 Anthropometry and body composition》
 提示:宽带有限、当前游客访问压缩模式
本系列图表出处文件名:随高清版一同展现
《Diabetes in the Kokan region of India》
Data are mean(standard deviation).P is adjusted for current age for anthropometry;body composition parameters are already age adjusted.BMI:Body mass index;WHR:Waist-to-hip ratio;TBW:Total body water;BMR:Basal metabolic rate.
In diabetic subjects of both sexes,those lean had significantly lower body fat(percentage as well as mass),lower muscle mass but high muscle mass percentage,lower visceral fat,lower fat free mass,higher total TBW%,but lower TBW and BMR compared to their overweight counterparts.Similar differences were observed in nondiabetic subjects between those lean and overweight of both sexes,except for TBW%which was similar in lean and overweight non-diabetic women(Tables 3 and 4).
| 图表编号 | XD0043270900 严禁用于非法目的 |
|---|---|
| 绘制时间 | 2019.01.15 |
| 作者 | Patil Suvarna、Kadam Shruti、Desai Maruti、Joglekar Charudatta |
| 绘制单位 | Department of Medicine, BKL Walawalkar Hospital and Rural Medical College、Department of Medicine, BKL Walawalkar Hospital and Rural Medical College、Statistics Unit, Regional Centre for Adolescent Health and Nutrition, BKL Walawalkar Hospital and Rural Med |
| 更多格式 | 高清、无水印(增值服务) |


