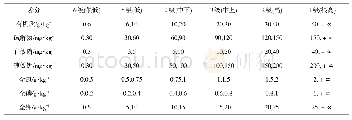
《Table 1 China’s environmental quality standards for surface water (GB 3838–2002) (mg/L)》
 提示:宽带有限、当前游客访问压缩模式
本系列图表出处文件名:随高清版一同展现
《Evaluation of Farmland Drainage Water Quality by Fuzzy–Gray Combination Method》
Due to the anomalies of the summer climate in 2013,the rainfall level was much less than usual.Low rainfall produces no runoff,which resulted in no apparent significant runoff for this study.As such,we selected three relatively large rainfalls as our study period from which to takesamples(June 25,July 31,and August 26 in 2013,with moderate rain and above).We tracked and monitored the concentrations and transport of N and P during the rainfall periods in the drainage ditches within the study area.As shown in Fig.3,points 1–9 indicate sampling points along the study ditch,of which point 9 is a ditch estuary and point 10 is a farmland estuary.We used the following water-quality indicators:dissolved oxygen(DO),chemical oxygen demand(COD Cr),total nitrogen(TN),ammonia nitrogen(AN),and total phosphorus(TP).We used Chinese national standard methods to monitor these indicators.Figure 4 shows plots of the monitored indicator data.For our evaluation criteria,we used China’s Environmental Quality Standards for Surface Water(GB 3838–2002)(Table 1) .
| 图表编号 | XD0042638000 严禁用于非法目的 |
|---|---|
| 绘制时间 | 2019.02.01 |
| 作者 | Xiaoling Wang、Songmin Li、Yuling Yan、Xiaotong Zheng、Fuchao Zhang |
| 绘制单位 | State Key Laboratory of Hydraulic Engineering Simulation and Safety, Tianjin University、State Key Laboratory of Hydraulic Engineering Simulation and Safety, Tianjin University、State Key Laboratory of Hydraulic Engineering Simulation and Safety, Tianjin Un |
| 更多格式 | 高清、无水印(增值服务) |


