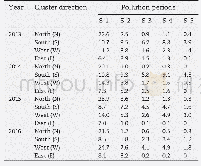
《Table 1–Airflow distribution under different pollution periods from 2013 to 2016 in Beijing (%) .》下
 提示:宽带有限、当前游客访问压缩模式
本系列图表出处文件名:随高清版一同展现
《A framework for investigating the air quality variation characteristics based on the monitoring data: Case study for Beijing during 2013–2016》
The contribution rates of pollutant(i.e.,PM2.5,NO2,SO2and CO)concentrations to the annual average concentrations under different airflow directions were calculated based on the method proposed in Section 2.5 from 2013 to 2016,and displayed in Table 2.It could be found that the contribution rates of typical pollutant(i.e.,PM2.5,NO2,SO2and CO)concentrations to the annual mean concentrations for west airflow and south airflow had the most significant changes during the period of 2013 to 2016,followed by north airflow,and the lower value appeared in east airflow direction.However,the differences were that the contribution rates of south airflow decreased with 23.8%,18.8%,16.9%and 20.1%for PM2.5,SO2,NO2and CO from 2013 to 2016,but those of west airflow increased with 29.1%,28.3%,24.6%and 26.8%,respectively.The contribution rates of north airflow were with fluctuation change.And the contribution rates of east airflow were always the lowest among four directions,with values of4.2%–16.1%,4.6%–16.3%,2.5%–16.1%and 5.3%–16.2%for PM2.5,SO2,NO2and CO,respectively.
| 图表编号 | XD0033531500 严禁用于非法目的 |
|---|---|
| 绘制时间 | 2019.07.15 |
| 作者 | Jixian Cui、Jianlei Lang、Tian Chen、Shushuai Mao、Shuiyuan Cheng、Zhanshan Wang、Nianliang Cheng |
| 绘制单位 | Key Laboratory of Beijing on Regional Air Pollution Control, College of Environmental & Energy Engineering, Beijing University of Technology、Key Laboratory of Beijing on Regional Air Pollution Control, College of Environmental & Energy Engineering, Beijin |
| 更多格式 | 高清、无水印(增值服务) |


